French vs Arapaho Single Mother Poverty
COMPARE
French
Arapaho
Single Mother Poverty
Single Mother Poverty Comparison
French
Arapaho
30.7%
SINGLE MOTHER POVERTY
1.3/ 100
METRIC RATING
244th/ 347
METRIC RANK
33.4%
SINGLE MOTHER POVERTY
0.0/ 100
METRIC RATING
302nd/ 347
METRIC RANK
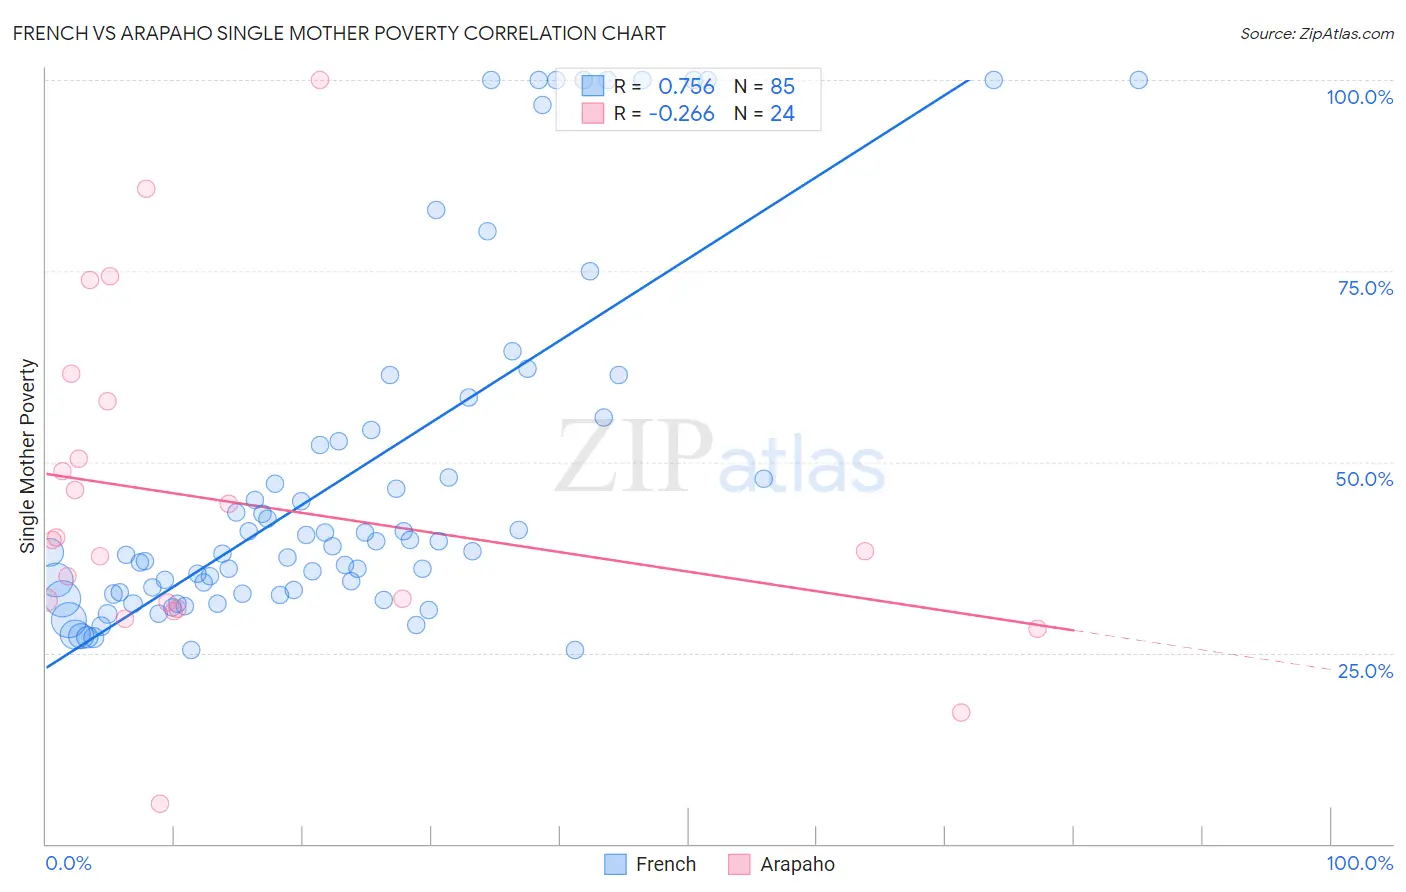
French vs Arapaho Single Mother Poverty Correlation Chart
The statistical analysis conducted on geographies consisting of 544,044,699 people shows a strong positive correlation between the proportion of French and poverty level among single mothers in the United States with a correlation coefficient (R) of 0.756 and weighted average of 30.7%. Similarly, the statistical analysis conducted on geographies consisting of 29,572,302 people shows a weak negative correlation between the proportion of Arapaho and poverty level among single mothers in the United States with a correlation coefficient (R) of -0.266 and weighted average of 33.4%, a difference of 9.0%.
Single Mother Poverty Correlation Summary
| Measurement | French | Arapaho |
| Minimum | 25.4% | 5.3% |
| Maximum | 100.0% | 100.0% |
| Range | 74.6% | 94.7% |
| Mean | 47.9% | 44.6% |
| Median | 38.3% | 39.0% |
| Interquartile 25% (IQ1) | 32.7% | 31.2% |
| Interquartile 75% (IQ3) | 53.4% | 54.1% |
| Interquartile Range (IQR) | 20.8% | 22.9% |
| Standard Deviation (Sample) | 23.1% | 21.8% |
| Standard Deviation (Population) | 23.0% | 21.3% |
Similar Demographics by Single Mother Poverty
Demographics Similar to French by Single Mother Poverty
In terms of single mother poverty, the demographic groups most similar to French are Barbadian (30.7%, a difference of 0.010%), Bermudan (30.6%, a difference of 0.22%), Immigrants from Burma/Myanmar (30.6%, a difference of 0.30%), Immigrants from Laos (30.6%, a difference of 0.32%), and Salvadoran (30.6%, a difference of 0.37%).
| Demographics | Rating | Rank | Single Mother Poverty |
| Immigrants | St. Vincent and the Grenadines | 3.1 /100 | #237 | Tragic 30.4% |
| Slovaks | 2.8 /100 | #238 | Tragic 30.4% |
| Immigrants | Portugal | 2.1 /100 | #239 | Tragic 30.5% |
| Salvadorans | 1.8 /100 | #240 | Tragic 30.6% |
| Immigrants | Laos | 1.8 /100 | #241 | Tragic 30.6% |
| Immigrants | Burma/Myanmar | 1.7 /100 | #242 | Tragic 30.6% |
| Bermudans | 1.6 /100 | #243 | Tragic 30.6% |
| French | 1.3 /100 | #244 | Tragic 30.7% |
| Barbadians | 1.3 /100 | #245 | Tragic 30.7% |
| Ecuadorians | 0.9 /100 | #246 | Tragic 30.8% |
| West Indians | 0.9 /100 | #247 | Tragic 30.8% |
| French Canadians | 0.9 /100 | #248 | Tragic 30.8% |
| Cape Verdeans | 0.8 /100 | #249 | Tragic 30.8% |
| Vietnamese | 0.7 /100 | #250 | Tragic 30.9% |
| Tlingit-Haida | 0.6 /100 | #251 | Tragic 30.9% |
Demographics Similar to Arapaho by Single Mother Poverty
In terms of single mother poverty, the demographic groups most similar to Arapaho are Immigrants from Somalia (33.4%, a difference of 0.15%), American (33.5%, a difference of 0.26%), Mexican (33.6%, a difference of 0.37%), Immigrants from Guatemala (33.3%, a difference of 0.39%), and Hispanic or Latino (33.3%, a difference of 0.39%).
| Demographics | Rating | Rank | Single Mother Poverty |
| Yaqui | 0.0 /100 | #295 | Tragic 33.1% |
| Blackfeet | 0.0 /100 | #296 | Tragic 33.2% |
| Pennsylvania Germans | 0.0 /100 | #297 | Tragic 33.2% |
| Africans | 0.0 /100 | #298 | Tragic 33.3% |
| Immigrants | Guatemala | 0.0 /100 | #299 | Tragic 33.3% |
| Hispanics or Latinos | 0.0 /100 | #300 | Tragic 33.3% |
| Immigrants | Somalia | 0.0 /100 | #301 | Tragic 33.4% |
| Arapaho | 0.0 /100 | #302 | Tragic 33.4% |
| Americans | 0.0 /100 | #303 | Tragic 33.5% |
| Mexicans | 0.0 /100 | #304 | Tragic 33.6% |
| Immigrants | Central America | 0.0 /100 | #305 | Tragic 33.6% |
| Immigrants | Congo | 0.0 /100 | #306 | Tragic 33.8% |
| Comanche | 0.0 /100 | #307 | Tragic 33.9% |
| Immigrants | Mexico | 0.0 /100 | #308 | Tragic 34.0% |
| Potawatomi | 0.0 /100 | #309 | Tragic 34.1% |