Central American Indian vs Shoshone Single Mother Poverty
COMPARE
Central American Indian
Shoshone
Single Mother Poverty
Single Mother Poverty Comparison
Central American Indians
Shoshone
34.3%
SINGLE MOTHER POVERTY
0.0/ 100
METRIC RATING
312th/ 347
METRIC RANK
32.9%
SINGLE MOTHER POVERTY
0.0/ 100
METRIC RATING
292nd/ 347
METRIC RANK
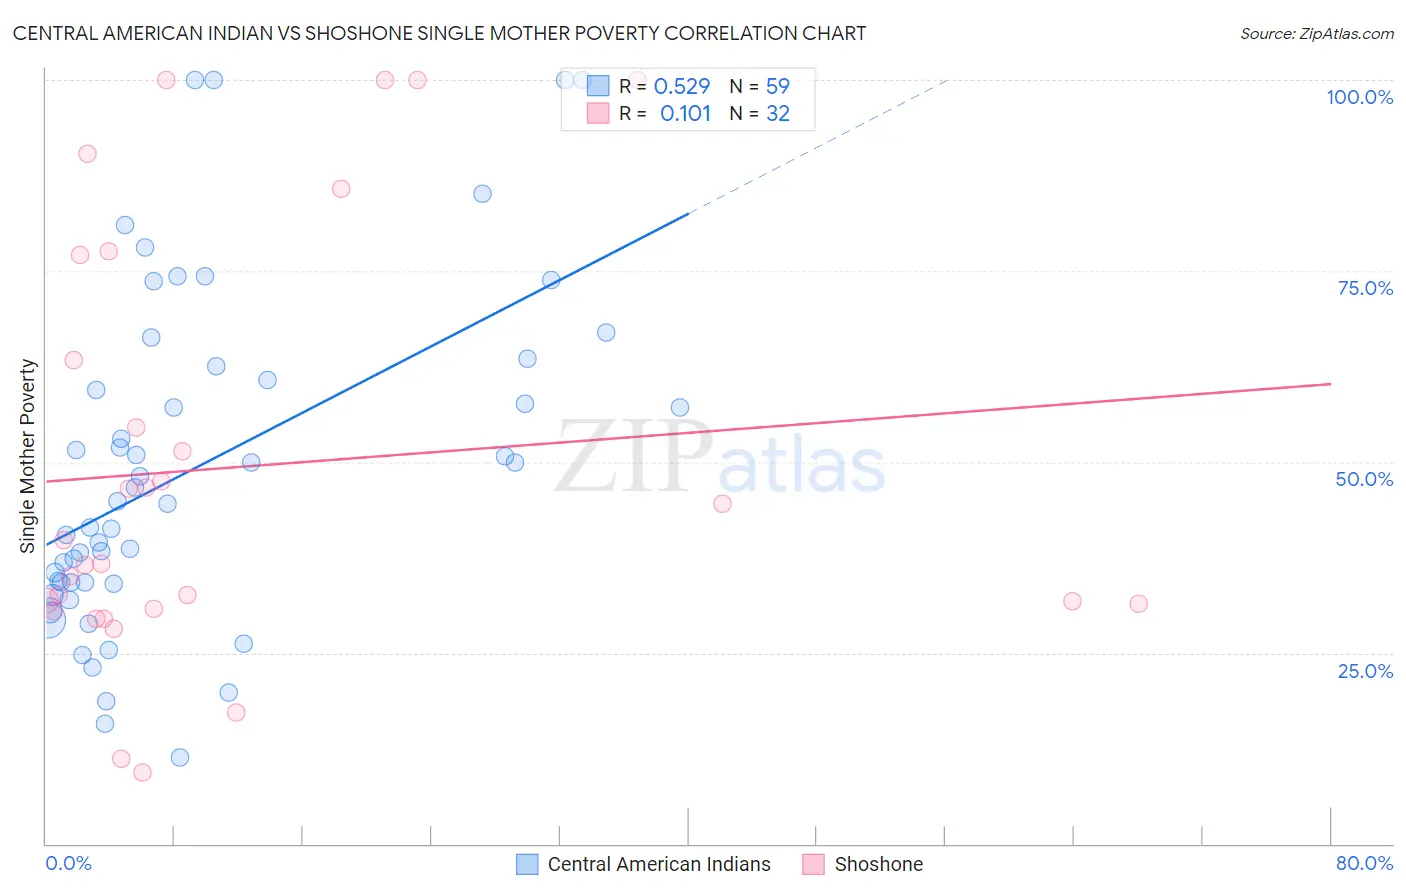
Central American Indian vs Shoshone Single Mother Poverty Correlation Chart
The statistical analysis conducted on geographies consisting of 321,816,529 people shows a substantial positive correlation between the proportion of Central American Indians and poverty level among single mothers in the United States with a correlation coefficient (R) of 0.529 and weighted average of 34.3%. Similarly, the statistical analysis conducted on geographies consisting of 66,288,381 people shows a poor positive correlation between the proportion of Shoshone and poverty level among single mothers in the United States with a correlation coefficient (R) of 0.101 and weighted average of 32.9%, a difference of 4.3%.
Single Mother Poverty Correlation Summary
| Measurement | Central American Indian | Shoshone |
| Minimum | 11.3% | 9.3% |
| Maximum | 100.0% | 100.0% |
| Range | 88.7% | 90.7% |
| Mean | 49.3% | 49.3% |
| Median | 44.9% | 38.2% |
| Interquartile 25% (IQ1) | 34.2% | 31.1% |
| Interquartile 75% (IQ3) | 62.6% | 70.2% |
| Interquartile Range (IQR) | 28.3% | 39.1% |
| Standard Deviation (Sample) | 22.0% | 27.4% |
| Standard Deviation (Population) | 21.8% | 27.0% |
Demographics Similar to Central American Indians and Shoshone by Single Mother Poverty
In terms of single mother poverty, the demographic groups most similar to Central American Indians are Alsatian (34.3%, a difference of 0.080%), Honduran (34.2%, a difference of 0.39%), Potawatomi (34.1%, a difference of 0.61%), Immigrants from Mexico (34.0%, a difference of 1.0%), and Comanche (33.9%, a difference of 1.2%). Similarly, the demographic groups most similar to Shoshone are Aleut (32.9%, a difference of 0.030%), French American Indian (33.1%, a difference of 0.66%), Yaqui (33.1%, a difference of 0.69%), Blackfeet (33.2%, a difference of 0.85%), and Pennsylvania German (33.2%, a difference of 0.99%).
| Demographics | Rating | Rank | Single Mother Poverty |
| Shoshone | 0.0 /100 | #292 | Tragic 32.9% |
| Aleuts | 0.0 /100 | #293 | Tragic 32.9% |
| French American Indians | 0.0 /100 | #294 | Tragic 33.1% |
| Yaqui | 0.0 /100 | #295 | Tragic 33.1% |
| Blackfeet | 0.0 /100 | #296 | Tragic 33.2% |
| Pennsylvania Germans | 0.0 /100 | #297 | Tragic 33.2% |
| Africans | 0.0 /100 | #298 | Tragic 33.3% |
| Immigrants | Guatemala | 0.0 /100 | #299 | Tragic 33.3% |
| Hispanics or Latinos | 0.0 /100 | #300 | Tragic 33.3% |
| Immigrants | Somalia | 0.0 /100 | #301 | Tragic 33.4% |
| Arapaho | 0.0 /100 | #302 | Tragic 33.4% |
| Americans | 0.0 /100 | #303 | Tragic 33.5% |
| Mexicans | 0.0 /100 | #304 | Tragic 33.6% |
| Immigrants | Central America | 0.0 /100 | #305 | Tragic 33.6% |
| Immigrants | Congo | 0.0 /100 | #306 | Tragic 33.8% |
| Comanche | 0.0 /100 | #307 | Tragic 33.9% |
| Immigrants | Mexico | 0.0 /100 | #308 | Tragic 34.0% |
| Potawatomi | 0.0 /100 | #309 | Tragic 34.1% |
| Hondurans | 0.0 /100 | #310 | Tragic 34.2% |
| Alsatians | 0.0 /100 | #311 | Tragic 34.3% |
| Central American Indians | 0.0 /100 | #312 | Tragic 34.3% |