Immigrants from Trinidad and Tobago vs Shoshone Single Mother Poverty
COMPARE
Immigrants from Trinidad and Tobago
Shoshone
Single Mother Poverty
Single Mother Poverty Comparison
Immigrants from Trinidad and Tobago
Shoshone
29.5%
SINGLE MOTHER POVERTY
29.2/ 100
METRIC RATING
191st/ 347
METRIC RANK
32.9%
SINGLE MOTHER POVERTY
0.0/ 100
METRIC RATING
292nd/ 347
METRIC RANK
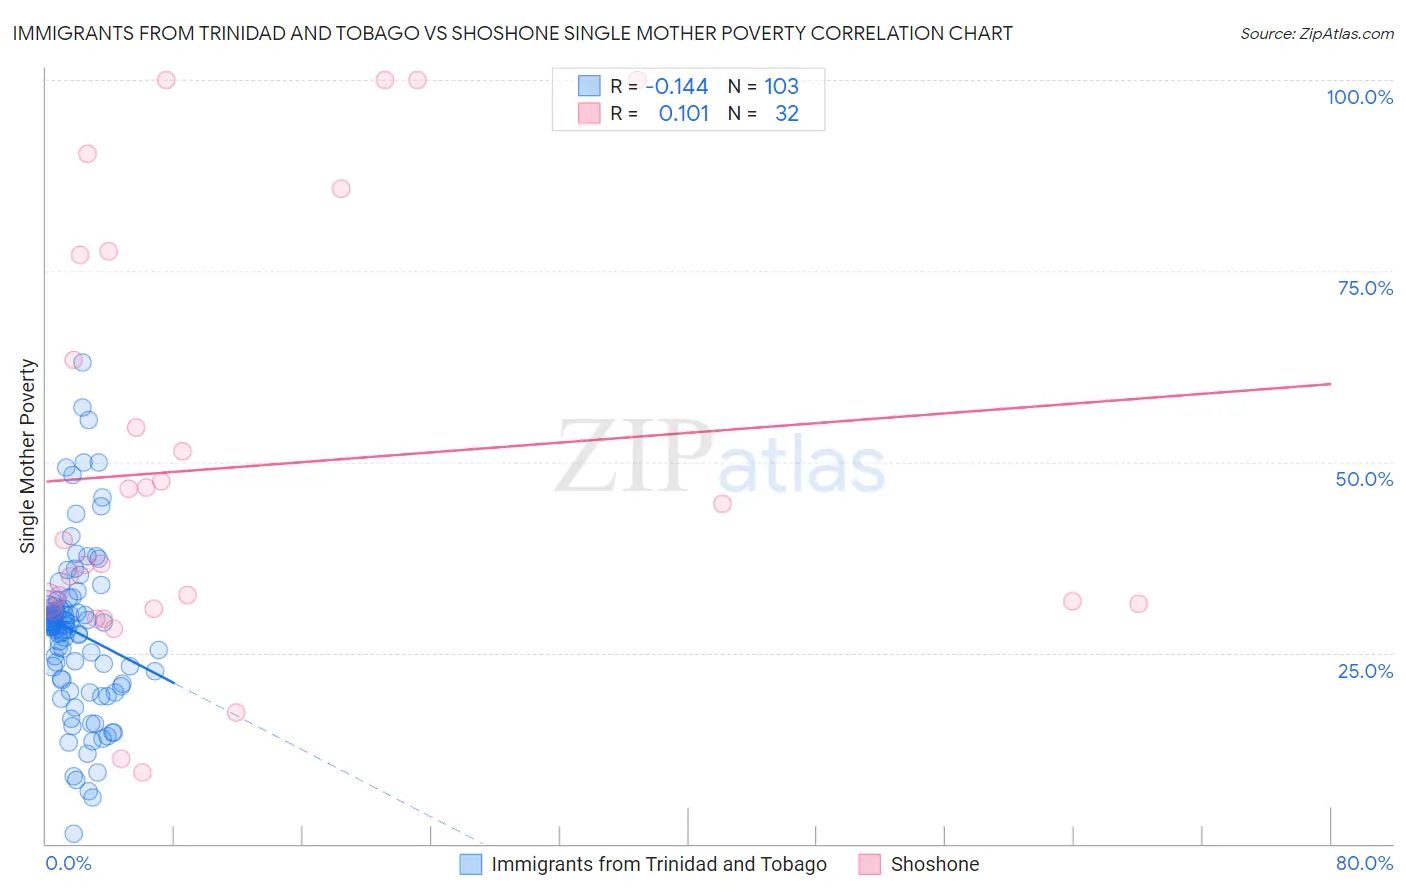
Immigrants from Trinidad and Tobago vs Shoshone Single Mother Poverty Correlation Chart
The statistical analysis conducted on geographies consisting of 220,062,629 people shows a poor negative correlation between the proportion of Immigrants from Trinidad and Tobago and poverty level among single mothers in the United States with a correlation coefficient (R) of -0.144 and weighted average of 29.5%. Similarly, the statistical analysis conducted on geographies consisting of 66,288,381 people shows a poor positive correlation between the proportion of Shoshone and poverty level among single mothers in the United States with a correlation coefficient (R) of 0.101 and weighted average of 32.9%, a difference of 11.7%.
Single Mother Poverty Correlation Summary
| Measurement | Immigrants from Trinidad and Tobago | Shoshone |
| Minimum | 1.3% | 9.3% |
| Maximum | 63.0% | 100.0% |
| Range | 61.7% | 90.7% |
| Mean | 27.7% | 49.3% |
| Median | 28.6% | 38.2% |
| Interquartile 25% (IQ1) | 21.0% | 31.1% |
| Interquartile 75% (IQ3) | 30.9% | 70.2% |
| Interquartile Range (IQR) | 9.9% | 39.1% |
| Standard Deviation (Sample) | 10.9% | 27.4% |
| Standard Deviation (Population) | 10.8% | 27.0% |
Similar Demographics by Single Mother Poverty
Demographics Similar to Immigrants from Trinidad and Tobago by Single Mother Poverty
In terms of single mother poverty, the demographic groups most similar to Immigrants from Trinidad and Tobago are Moroccan (29.5%, a difference of 0.030%), Basque (29.5%, a difference of 0.050%), Immigrants from Germany (29.5%, a difference of 0.070%), Immigrants from Africa (29.4%, a difference of 0.13%), and Guamanian/Chamorro (29.4%, a difference of 0.14%).
| Demographics | Rating | Rank | Single Mother Poverty |
| Nigerians | 38.0 /100 | #184 | Fair 29.3% |
| Ghanaians | 36.8 /100 | #185 | Fair 29.4% |
| Yugoslavians | 36.0 /100 | #186 | Fair 29.4% |
| Lebanese | 32.5 /100 | #187 | Fair 29.4% |
| Guamanians/Chamorros | 31.8 /100 | #188 | Fair 29.4% |
| Immigrants | Africa | 31.6 /100 | #189 | Fair 29.4% |
| Immigrants | Germany | 30.4 /100 | #190 | Fair 29.5% |
| Immigrants | Trinidad and Tobago | 29.2 /100 | #191 | Fair 29.5% |
| Moroccans | 28.6 /100 | #192 | Fair 29.5% |
| Basques | 28.3 /100 | #193 | Fair 29.5% |
| Icelanders | 26.1 /100 | #194 | Fair 29.5% |
| Slavs | 24.5 /100 | #195 | Fair 29.6% |
| Spanish American Indians | 23.4 /100 | #196 | Fair 29.6% |
| Immigrants | Jamaica | 22.0 /100 | #197 | Fair 29.6% |
| Trinidadians and Tobagonians | 21.7 /100 | #198 | Fair 29.6% |
Demographics Similar to Shoshone by Single Mother Poverty
In terms of single mother poverty, the demographic groups most similar to Shoshone are Guatemalan (32.9%, a difference of 0.020%), Aleut (32.9%, a difference of 0.030%), French American Indian (33.1%, a difference of 0.66%), Yaqui (33.1%, a difference of 0.69%), and Blackfeet (33.2%, a difference of 0.85%).
| Demographics | Rating | Rank | Single Mother Poverty |
| Immigrants | Latin America | 0.0 /100 | #285 | Tragic 32.4% |
| Yup'ik | 0.0 /100 | #286 | Tragic 32.5% |
| Immigrants | Dominica | 0.0 /100 | #287 | Tragic 32.5% |
| Somalis | 0.0 /100 | #288 | Tragic 32.6% |
| U.S. Virgin Islanders | 0.0 /100 | #289 | Tragic 32.6% |
| Osage | 0.0 /100 | #290 | Tragic 32.6% |
| Guatemalans | 0.0 /100 | #291 | Tragic 32.9% |
| Shoshone | 0.0 /100 | #292 | Tragic 32.9% |
| Aleuts | 0.0 /100 | #293 | Tragic 32.9% |
| French American Indians | 0.0 /100 | #294 | Tragic 33.1% |
| Yaqui | 0.0 /100 | #295 | Tragic 33.1% |
| Blackfeet | 0.0 /100 | #296 | Tragic 33.2% |
| Pennsylvania Germans | 0.0 /100 | #297 | Tragic 33.2% |
| Africans | 0.0 /100 | #298 | Tragic 33.3% |
| Immigrants | Guatemala | 0.0 /100 | #299 | Tragic 33.3% |