Chinese vs Immigrants from Ghana Female Poverty
COMPARE
Chinese
Immigrants from Ghana
Female Poverty
Female Poverty Comparison
Chinese
Immigrants from Ghana
10.4%
FEMALE POVERTY
100.0/ 100
METRIC RATING
2nd/ 347
METRIC RANK
15.3%
FEMALE POVERTY
0.3/ 100
METRIC RATING
248th/ 347
METRIC RANK
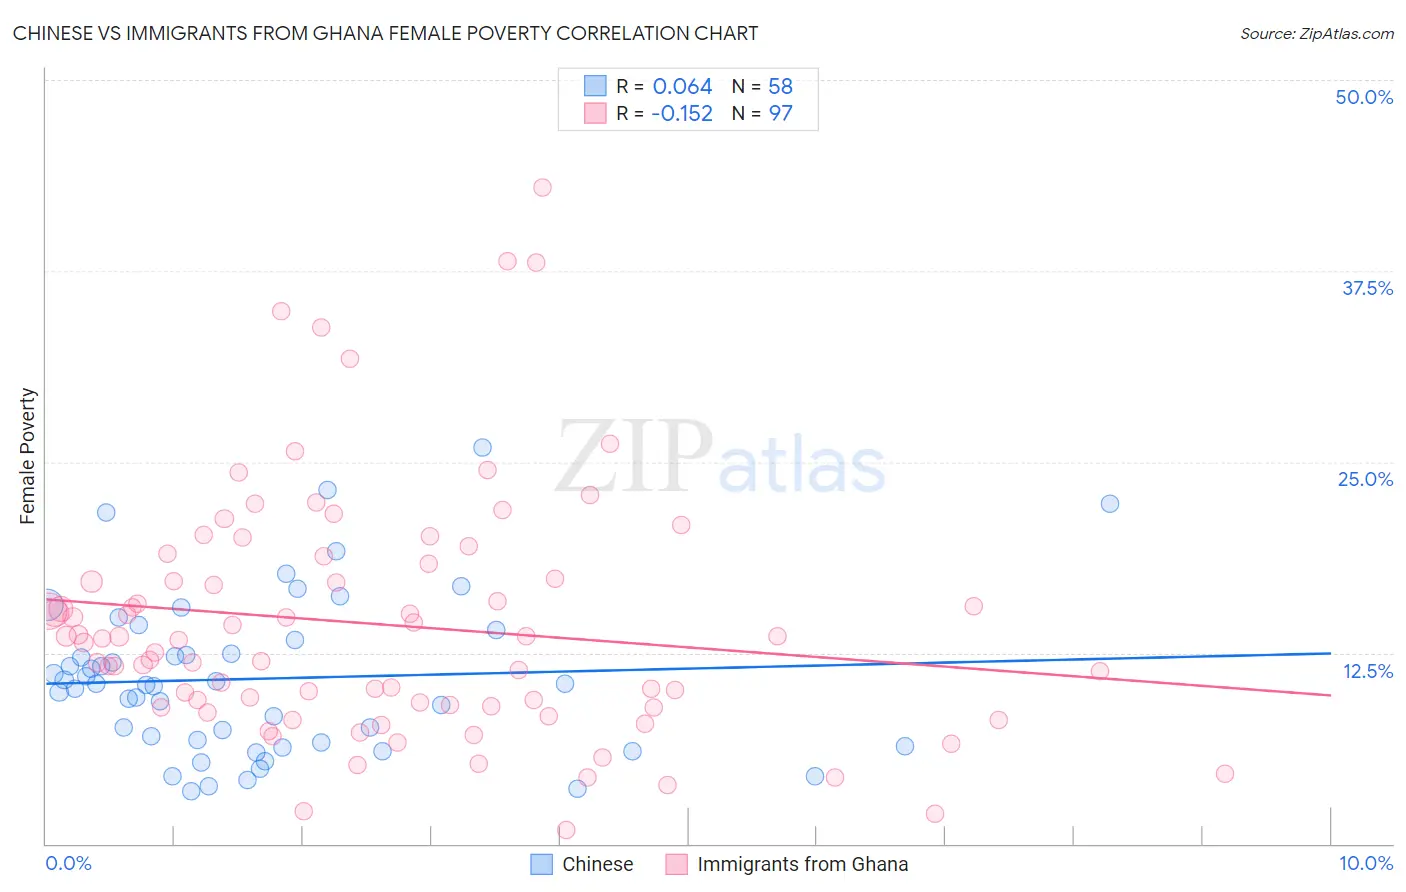
Chinese vs Immigrants from Ghana Female Poverty Correlation Chart
The statistical analysis conducted on geographies consisting of 64,802,428 people shows a slight positive correlation between the proportion of Chinese and poverty level among females in the United States with a correlation coefficient (R) of 0.064 and weighted average of 10.4%. Similarly, the statistical analysis conducted on geographies consisting of 199,796,197 people shows a poor negative correlation between the proportion of Immigrants from Ghana and poverty level among females in the United States with a correlation coefficient (R) of -0.152 and weighted average of 15.3%, a difference of 47.3%.
Female Poverty Correlation Summary
| Measurement | Chinese | Immigrants from Ghana |
| Minimum | 3.4% | 0.90% |
| Maximum | 25.9% | 43.0% |
| Range | 22.5% | 42.1% |
| Mean | 10.8% | 14.3% |
| Median | 10.4% | 13.3% |
| Interquartile 25% (IQ1) | 6.6% | 9.0% |
| Interquartile 75% (IQ3) | 13.3% | 17.8% |
| Interquartile Range (IQR) | 6.7% | 8.9% |
| Standard Deviation (Sample) | 5.2% | 8.1% |
| Standard Deviation (Population) | 5.1% | 8.0% |
Similar Demographics by Female Poverty
Demographics Similar to Chinese by Female Poverty
In terms of female poverty, the demographic groups most similar to Chinese are Thai (10.5%, a difference of 0.65%), Immigrants from Taiwan (10.5%, a difference of 1.4%), Immigrants from India (9.9%, a difference of 5.2%), Filipino (10.9%, a difference of 5.4%), and Immigrants from Ireland (11.0%, a difference of 5.8%).
| Demographics | Rating | Rank | Female Poverty |
| Immigrants | India | 100.0 /100 | #1 | Exceptional 9.9% |
| Chinese | 100.0 /100 | #2 | Exceptional 10.4% |
| Thais | 100.0 /100 | #3 | Exceptional 10.5% |
| Immigrants | Taiwan | 100.0 /100 | #4 | Exceptional 10.5% |
| Filipinos | 100.0 /100 | #5 | Exceptional 10.9% |
| Immigrants | Ireland | 99.9 /100 | #6 | Exceptional 11.0% |
| Assyrians/Chaldeans/Syriacs | 99.9 /100 | #7 | Exceptional 11.0% |
| Immigrants | South Central Asia | 99.9 /100 | #8 | Exceptional 11.1% |
| Bulgarians | 99.9 /100 | #9 | Exceptional 11.1% |
| Immigrants | Hong Kong | 99.9 /100 | #10 | Exceptional 11.2% |
| Maltese | 99.9 /100 | #11 | Exceptional 11.2% |
| Bhutanese | 99.9 /100 | #12 | Exceptional 11.3% |
| Immigrants | Lithuania | 99.9 /100 | #13 | Exceptional 11.3% |
| Lithuanians | 99.8 /100 | #14 | Exceptional 11.4% |
| Latvians | 99.8 /100 | #15 | Exceptional 11.4% |
Demographics Similar to Immigrants from Ghana by Female Poverty
In terms of female poverty, the demographic groups most similar to Immigrants from Ghana are Potawatomi (15.3%, a difference of 0.0%), Cuban (15.3%, a difference of 0.010%), Spanish American Indian (15.3%, a difference of 0.060%), Salvadoran (15.3%, a difference of 0.14%), and Ecuadorian (15.3%, a difference of 0.16%).
| Demographics | Rating | Rank | Female Poverty |
| Immigrants | Sudan | 0.4 /100 | #241 | Tragic 15.2% |
| Nepalese | 0.4 /100 | #242 | Tragic 15.2% |
| Nicaraguans | 0.3 /100 | #243 | Tragic 15.3% |
| Ecuadorians | 0.3 /100 | #244 | Tragic 15.3% |
| Spanish American Indians | 0.3 /100 | #245 | Tragic 15.3% |
| Cubans | 0.3 /100 | #246 | Tragic 15.3% |
| Potawatomi | 0.3 /100 | #247 | Tragic 15.3% |
| Immigrants | Ghana | 0.3 /100 | #248 | Tragic 15.3% |
| Salvadorans | 0.3 /100 | #249 | Tragic 15.3% |
| Immigrants | Western Africa | 0.3 /100 | #250 | Tragic 15.3% |
| Immigrants | Trinidad and Tobago | 0.3 /100 | #251 | Tragic 15.4% |
| Immigrants | Burma/Myanmar | 0.3 /100 | #252 | Tragic 15.4% |
| Liberians | 0.2 /100 | #253 | Tragic 15.4% |
| Trinidadians and Tobagonians | 0.2 /100 | #254 | Tragic 15.4% |
| Ottawa | 0.2 /100 | #255 | Tragic 15.5% |