Chilean vs Immigrants from Sierra Leone Disability Age 18 to 34

COMPARE

Chilean
Race
Ancestry
AfghanAfricanAlaska NativeAlaskan AthabascanAlbanianAleutAlsatianAmericanApacheArabArapahoArgentineanArmenianAssyrian/Chaldean/SyriacAustralianAustrianBahamianBangladeshiBarbadianBasqueBelgianBelizeanBermudanBhutaneseBlackfeetBolivianBrazilianBritishBritish West IndianBulgarianBurmeseCajunCambodianCanadianCape VerdeanCarpatho RusynCelticCentral AmericanCentral American IndianCherokeeCheyenneChickasawChileanChineseChippewaChoctawColombianColvilleComancheCosta RicanCreeCreekCroatianCrowCubanCypriotCzechCzechoslovakianDanishDelawareDominicanDutchDutch West IndianEastern EuropeanEcuadorianEgyptianEnglishEstonianEthiopianEuropeanFijianFilipinoFinnishFrenchFrench American IndianFrench CanadianGermanGerman RussianGhanaianGreekGuamanian/ChamorroGuatemalanGuyaneseHaitianHmongHonduranHopiHoumaHungarianIcelanderIndian (Asian)IndonesianInupiatIranianIraqiIrishIroquoisIsraeliItalianJamaicanJapaneseJordanianKenyanKiowaKoreanLaotianLatvianLebaneseLiberianLithuanianLumbeeLuxembourgerMacedonianMalaysianMalteseMarshalleseMenomineeMexicanMexican American IndianMongolianMoroccanNative HawaiianNavajoNepaleseNew ZealanderNicaraguanNigerianNorthern EuropeanNorwegianOkinawanOsageOttawaPaiutePakistaniPalestinianPanamanianParaguayanPennsylvania GermanPeruvianPimaPolishPortuguesePotawatomiPuebloPuerto RicanPuget Sound SalishRomanianRussianSalvadoranSamoanScandinavianScotch-IrishScottishSeminoleSenegaleseSerbianShoshoneSierra LeoneanSiouxSlavicSlovakSloveneSomaliSouth AfricanSouth AmericanSouth American IndianSoviet UnionSpaniardSpanishSpanish AmericanSpanish American IndianSri LankanSubsaharan AfricanSudaneseSwedishSwissSyrianTaiwaneseThaiTlingit-HaidaTohono O'OdhamTonganTrinidadian and TobagonianTsimshianTurkishU.S. Virgin IslanderUgandanUkrainianUruguayanUteVenezuelanVietnameseWelshWest IndianYakamaYaquiYugoslavianYumanYup'ikZimbabwean
Immigration
NonimmigrantsImmigrantsAfghanistanAfricaAlbaniaArgentinaArmeniaAsiaAustraliaAustriaBahamasBangladeshBarbadosBelarusBelgiumBelizeBoliviaBosnia and HerzegovinaBrazilBulgariaBurma/MyanmarCabo VerdeCambodiaCameroonCanadaCaribbeanCentral AmericaChileChinaColombiaCongoCosta RicaCroatiaCubaCzechoslovakiaDenmarkDominicaDominican RepublicEastern AfricaEastern AsiaEastern EuropeEcuadorEgyptEl SalvadorEnglandEritreaEthiopiaEuropeFijiFranceGermanyGhanaGreeceGrenadaGuatemalaGuyanaHaitiHondurasHong KongHungaryIndiaIndonesiaIranIraqIrelandIsraelItalyJamaicaJapanJordanKazakhstanKenyaKoreaKuwaitLaosLatin AmericaLatviaLebanonLiberiaLithuaniaMalaysiaMexicoMicronesiaMiddle AfricaMoldovaMoroccoNepalNetherlandsNicaraguaNigeriaNorth AmericaNorth MacedoniaNorthern AfricaNorthern EuropeNorwayOceaniaPakistanPanamaPeruPhilippinesPolandPortugalRomaniaRussiaSaudi ArabiaScotlandSenegalSerbiaSingaporeSomaliaSouth AfricaSouth AmericaSouth Central AsiaSouth Eastern AsiaSouthern EuropeSpainSri LankaSt. Vincent and the GrenadinesSudanSwedenSwitzerlandSyriaTaiwanThailandTrinidad and TobagoTurkeyUgandaUkraineUruguayUzbekistanVenezuelaVietnamWest IndiesWestern AfricaWestern AsiaWestern EuropeYemenZaireZimbabweAzores
Immigrants from Sierra Leone
Race
Ancestry
AfghanAfricanAlaska NativeAlaskan AthabascanAlbanianAleutAlsatianAmericanApacheArabArapahoArgentineanArmenianAssyrian/Chaldean/SyriacAustralianAustrianBahamianBangladeshiBarbadianBasqueBelgianBelizeanBermudanBhutaneseBlackfeetBolivianBrazilianBritishBritish West IndianBulgarianBurmeseCajunCambodianCanadianCape VerdeanCarpatho RusynCelticCentral AmericanCentral American IndianCherokeeCheyenneChickasawChineseChippewaChoctawColombianColvilleComancheCosta RicanCreeCreekCroatianCrowCubanCypriotCzechCzechoslovakianDanishDelawareDominicanDutchDutch West IndianEastern EuropeanEcuadorianEgyptianEnglishEstonianEthiopianEuropeanFijianFilipinoFinnishFrenchFrench American IndianFrench CanadianGermanGerman RussianGhanaianGreekGuamanian/ChamorroGuatemalanGuyaneseHaitianHmongHonduranHopiHoumaHungarianIcelanderIndian (Asian)IndonesianInupiatIranianIraqiIrishIroquoisIsraeliItalianJamaicanJapaneseJordanianKenyanKiowaKoreanLaotianLatvianLebaneseLiberianLithuanianLumbeeLuxembourgerMacedonianMalaysianMalteseMarshalleseMenomineeMexicanMexican American IndianMongolianMoroccanNative HawaiianNavajoNepaleseNew ZealanderNicaraguanNigerianNorthern EuropeanNorwegianOkinawanOsageOttawaPaiutePakistaniPalestinianPanamanianParaguayanPennsylvania GermanPeruvianPimaPolishPortuguesePotawatomiPuebloPuerto RicanPuget Sound SalishRomanianRussianSalvadoranSamoanScandinavianScotch-IrishScottishSeminoleSenegaleseSerbianShoshoneSierra LeoneanSiouxSlavicSlovakSloveneSomaliSouth AfricanSouth AmericanSouth American IndianSoviet UnionSpaniardSpanishSpanish AmericanSpanish American IndianSri LankanSubsaharan AfricanSudaneseSwedishSwissSyrianTaiwaneseThaiTlingit-HaidaTohono O'OdhamTonganTrinidadian and TobagonianTsimshianTurkishU.S. Virgin IslanderUgandanUkrainianUruguayanUteVenezuelanVietnameseWelshWest IndianYakamaYaquiYugoslavianYumanYup'ikZimbabwean
Immigration
NonimmigrantsImmigrantsAfghanistanAfricaAlbaniaArgentinaArmeniaAsiaAustraliaAustriaBahamasBangladeshBarbadosBelarusBelgiumBelizeBoliviaBosnia and HerzegovinaBrazilBulgariaBurma/MyanmarCabo VerdeCambodiaCameroonCanadaCaribbeanCentral AmericaChileChinaColombiaCongoCosta RicaCroatiaCubaCzechoslovakiaDenmarkDominicaDominican RepublicEastern AfricaEastern AsiaEastern EuropeEcuadorEgyptEl SalvadorEnglandEritreaEthiopiaEuropeFijiFranceGermanyGhanaGreeceGrenadaGuatemalaGuyanaHaitiHondurasHong KongHungaryIndiaIndonesiaIranIraqIrelandIsraelItalyJamaicaJapanJordanKazakhstanKenyaKoreaKuwaitLaosLatin AmericaLatviaLebanonLiberiaLithuaniaMalaysiaMexicoMicronesiaMiddle AfricaMoldovaMoroccoNepalNetherlandsNicaraguaNigeriaNorth AmericaNorth MacedoniaNorthern AfricaNorthern EuropeNorwayOceaniaPakistanPanamaPeruPhilippinesPolandPortugalRomaniaRussiaSaudi ArabiaScotlandSenegalSerbiaSierra LeoneSingaporeSomaliaSouth AfricaSouth AmericaSouth Central AsiaSouth Eastern AsiaSouthern EuropeSpainSri LankaSt. Vincent and the GrenadinesSudanSwedenSwitzerlandSyriaTaiwanThailandTrinidad and TobagoTurkeyUgandaUkraineUruguayUzbekistanVenezuelaVietnamWest IndiesWestern AfricaWestern AsiaWestern EuropeYemenZaireZimbabweAzores
Disability Age 18 to 34
Income
Poverty
Unemployment
Labor Participation
Family Structure
Vehicle Availability
Education Level
Disability

Disability Age 18 to 34 Comparison

Chileans

Immigrants from Sierra Leone

Exceptional
Good
6.3%
DISABILITY AGE 18 TO 34
93.5/ 100
METRIC RATING
119th/ 347
METRIC RANK
6.5%
DISABILITY AGE 18 TO 34
75.0/ 100
METRIC RATING
157th/ 347
METRIC RANK

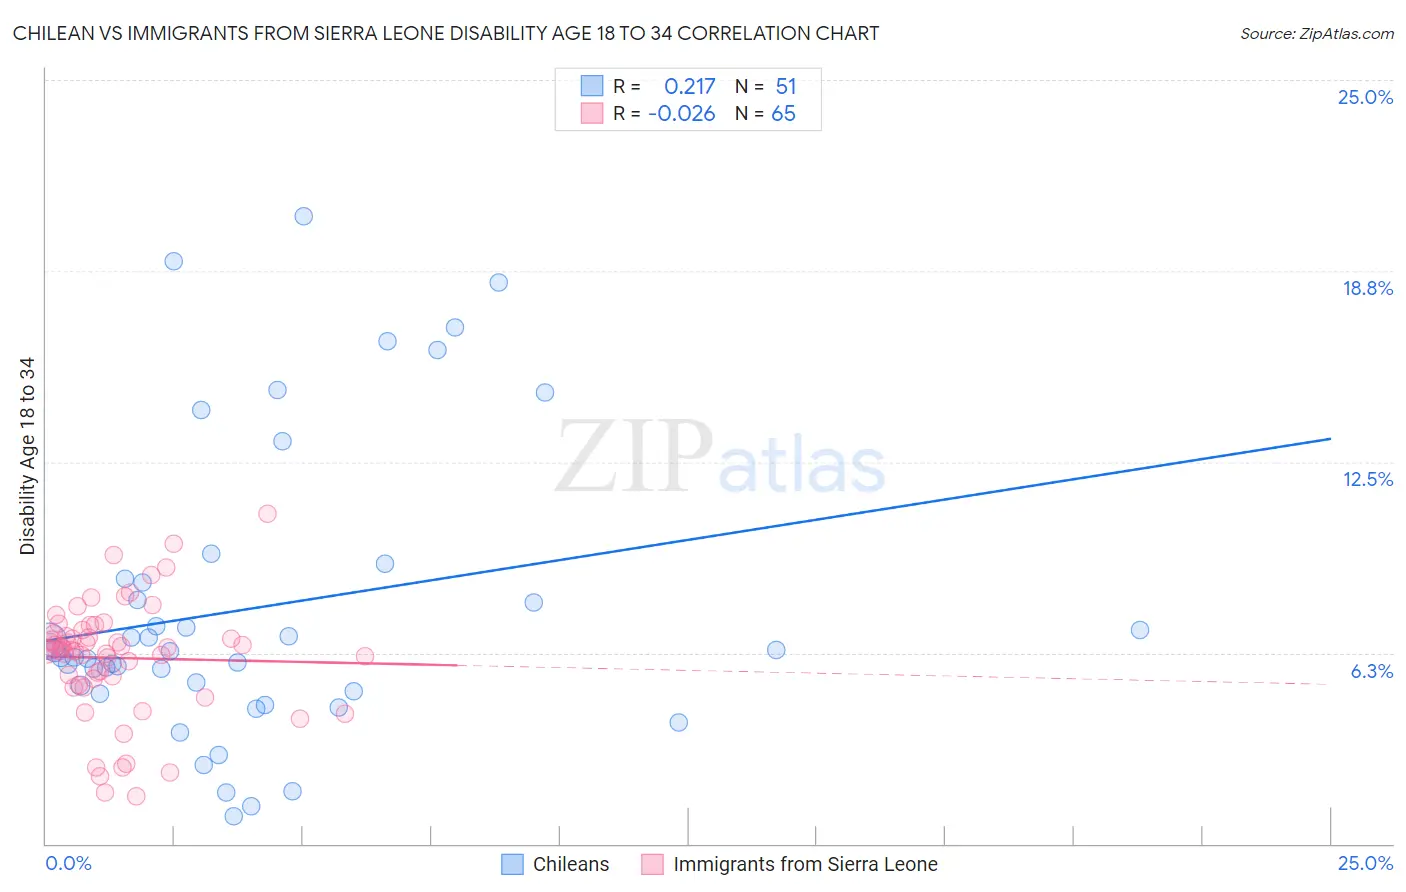
Chilean vs Immigrants from Sierra Leone Disability Age 18 to 34 Correlation Chart

The statistical analysis conducted on geographies consisting of 256,471,605 people shows a weak positive correlation between the proportion of Chileans and percentage of population with a disability between the ages 18 and 35 in the United States with a correlation coefficient (R) of 0.217 and weighted average of 6.3%. Similarly, the statistical analysis conducted on geographies consisting of 101,637,669 people shows no correlation between the proportion of Immigrants from Sierra Leone and percentage of population with a disability between the ages 18 and 35 in the United States with a correlation coefficient (R) of -0.026 and weighted average of 6.5%, a difference of 2.8%.
Chilean vs Immigrants from Sierra Leone Disability Age 18 to 34

Disability Age 18 to 34 Correlation Summary

MeasurementChileanImmigrants from Sierra Leone
Minimum0.92%1.6%
Maximum20.5%10.8%
Range19.6%9.3%
Mean7.7%6.1%
Median6.3%6.4%
Interquartile 25% (IQ1)5.0%5.3%
Interquartile 75% (IQ3)8.7%6.9%
Interquartile Range (IQR)3.7%1.6%
Standard Deviation (Sample)4.8%1.9%
Standard Deviation (Population)4.8%1.9%

Similar Demographics by Disability Age 18 to 34

Demographics Similar to Chileans by Disability Age 18 to 34

In terms of disability age 18 to 34, the demographic groups most similar to Chileans are Immigrants from Ukraine (6.3%, a difference of 0.030%), Immigrants from Guatemala (6.3%, a difference of 0.030%), Immigrants from Nepal (6.3%, a difference of 0.050%), Immigrants from Czechoslovakia (6.3%, a difference of 0.050%), and Immigrants from Costa Rica (6.3%, a difference of 0.15%).
DemographicsRating | RankDisability Age 18 to 34
Immigrants | Romania
94.9
/100
|
#112
Exceptional
6.3%
Immigrants | Latin America
94.9
/100
|
#113
Exceptional
6.3%
Immigrants | South Eastern Asia
94.4
/100
|
#114
Exceptional
6.3%
Koreans
94.1
/100
|
#115
Exceptional
6.3%
Immigrants | Costa Rica
94.0
/100
|
#116
Exceptional
6.3%
Immigrants | Jordan
94.0
/100
|
#117
Exceptional
6.3%
Immigrants | Nepal
93.7
/100
|
#118
Exceptional
6.3%
Chileans
93.5
/100
|
#119
Exceptional
6.3%
Immigrants | Ukraine
93.4
/100
|
#120
Exceptional
6.3%
Immigrants | Guatemala
93.4
/100
|
#121
Exceptional
6.3%
Immigrants | Czechoslovakia
93.3
/100
|
#122
Exceptional
6.3%
Costa Ricans
92.9
/100
|
#123
Exceptional
6.3%
Immigrants | Morocco
92.9
/100
|
#124
Exceptional
6.3%
Macedonians
92.6
/100
|
#125
Exceptional
6.3%
Immigrants | Switzerland
92.5
/100
|
#126
Exceptional
6.3%

Demographics Similar to Immigrants from Sierra Leone by Disability Age 18 to 34

In terms of disability age 18 to 34, the demographic groups most similar to Immigrants from Sierra Leone are Immigrants from Panama (6.5%, a difference of 0.030%), Zimbabwean (6.5%, a difference of 0.030%), Dominican (6.5%, a difference of 0.14%), Immigrants from Central America (6.5%, a difference of 0.17%), and Inupiat (6.5%, a difference of 0.17%).
DemographicsRating | RankDisability Age 18 to 34
Immigrants | Dominican Republic
82.7
/100
|
#150
Excellent
6.4%
Tongans
81.9
/100
|
#151
Excellent
6.4%
Bulgarians
78.3
/100
|
#152
Good
6.5%
Immigrants | Eritrea
77.4
/100
|
#153
Good
6.5%
Immigrants | Central America
76.8
/100
|
#154
Good
6.5%
Inupiat
76.7
/100
|
#155
Good
6.5%
Immigrants | Panama
75.3
/100
|
#156
Good
6.5%
Immigrants | Sierra Leone
75.0
/100
|
#157
Good
6.5%
Zimbabweans
74.7
/100
|
#158
Good
6.5%
Dominicans
73.6
/100
|
#159
Good
6.5%
Immigrants | Southern Europe
72.5
/100
|
#160
Good
6.5%
Arabs
72.3
/100
|
#161
Good
6.5%
South Africans
71.7
/100
|
#162
Good
6.5%
Immigrants | Denmark
71.7
/100
|
#163
Good
6.5%
Immigrants | Nigeria
70.4
/100
|
#164
Good
6.5%