Inupiat vs Immigrants from Sierra Leone Family Poverty
COMPARE
Inupiat
Immigrants from Sierra Leone
Family Poverty
Family Poverty Comparison
Inupiat
Immigrants from Sierra Leone
12.5%
FAMILY POVERTY
0.0/ 100
METRIC RATING
320th/ 347
METRIC RANK
9.4%
FAMILY POVERTY
19.6/ 100
METRIC RATING
202nd/ 347
METRIC RANK
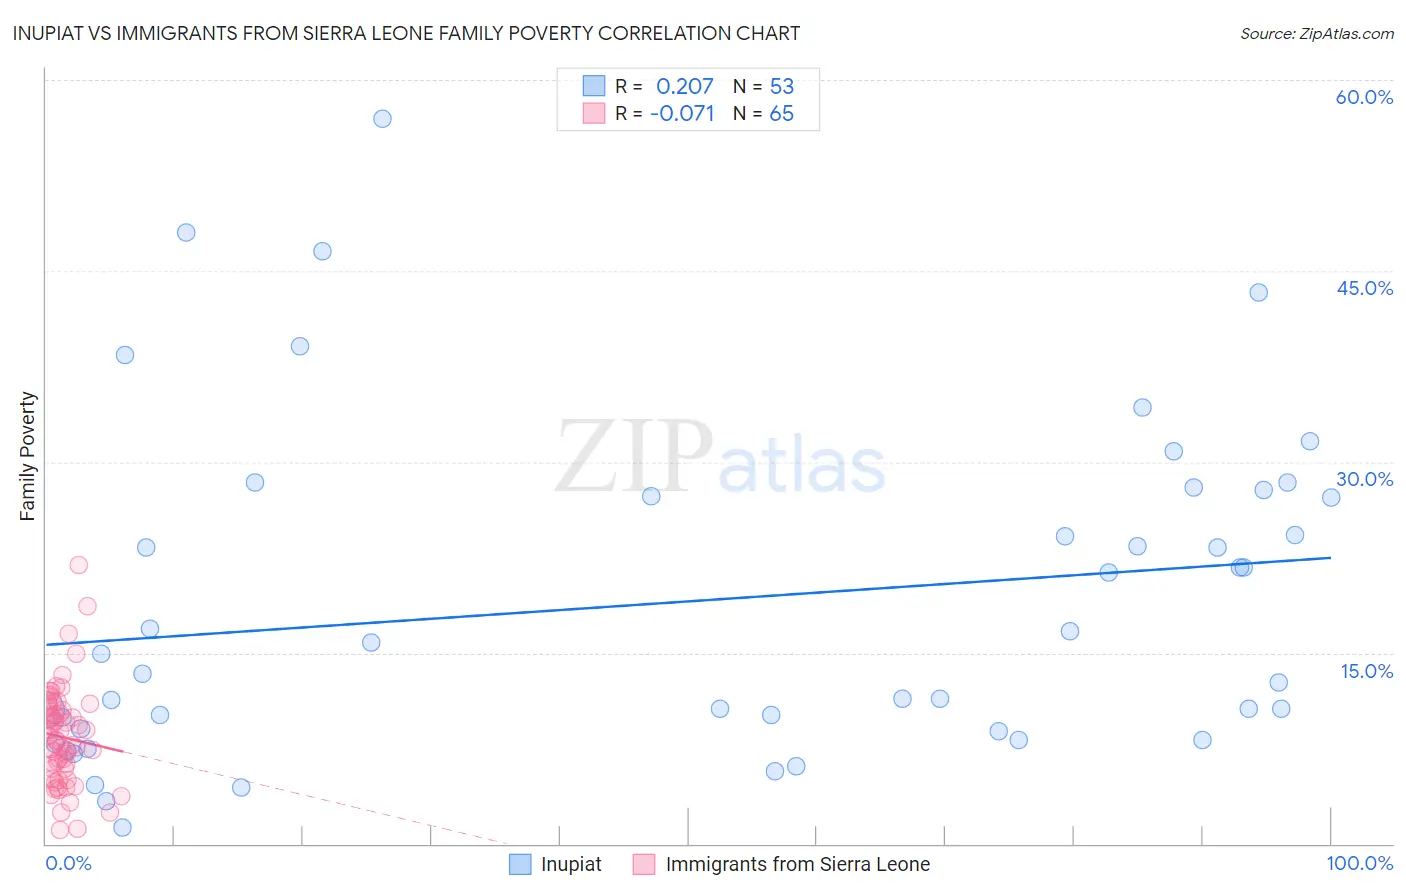
Inupiat vs Immigrants from Sierra Leone Family Poverty Correlation Chart
The statistical analysis conducted on geographies consisting of 96,272,852 people shows a weak positive correlation between the proportion of Inupiat and poverty level among families in the United States with a correlation coefficient (R) of 0.207 and weighted average of 12.5%. Similarly, the statistical analysis conducted on geographies consisting of 101,579,524 people shows a slight negative correlation between the proportion of Immigrants from Sierra Leone and poverty level among families in the United States with a correlation coefficient (R) of -0.071 and weighted average of 9.4%, a difference of 32.3%.
Family Poverty Correlation Summary
| Measurement | Inupiat | Immigrants from Sierra Leone |
| Minimum | 1.3% | 1.1% |
| Maximum | 56.9% | 21.9% |
| Range | 55.6% | 20.8% |
| Mean | 19.0% | 8.4% |
| Median | 14.9% | 8.1% |
| Interquartile 25% (IQ1) | 8.9% | 5.5% |
| Interquartile 75% (IQ3) | 27.5% | 10.6% |
| Interquartile Range (IQR) | 18.6% | 5.1% |
| Standard Deviation (Sample) | 12.9% | 3.9% |
| Standard Deviation (Population) | 12.8% | 3.9% |
Similar Demographics by Family Poverty
Demographics Similar to Inupiat by Family Poverty
In terms of family poverty, the demographic groups most similar to Inupiat are British West Indian (12.4%, a difference of 0.48%), U.S. Virgin Islander (12.4%, a difference of 0.53%), Immigrants from Grenada (12.4%, a difference of 0.54%), Honduran (12.4%, a difference of 0.76%), and Immigrants from Mexico (12.3%, a difference of 1.5%).
| Demographics | Rating | Rank | Family Poverty |
| Immigrants | Caribbean | 0.0 /100 | #313 | Tragic 12.2% |
| Kiowa | 0.0 /100 | #314 | Tragic 12.2% |
| Immigrants | Mexico | 0.0 /100 | #315 | Tragic 12.3% |
| Hondurans | 0.0 /100 | #316 | Tragic 12.4% |
| Immigrants | Grenada | 0.0 /100 | #317 | Tragic 12.4% |
| U.S. Virgin Islanders | 0.0 /100 | #318 | Tragic 12.4% |
| British West Indians | 0.0 /100 | #319 | Tragic 12.4% |
| Inupiat | 0.0 /100 | #320 | Tragic 12.5% |
| Arapaho | 0.0 /100 | #321 | Tragic 12.7% |
| Immigrants | Honduras | 0.0 /100 | #322 | Tragic 12.7% |
| Menominee | 0.0 /100 | #323 | Tragic 12.7% |
| Immigrants | Dominica | 0.0 /100 | #324 | Tragic 12.7% |
| Paiute | 0.0 /100 | #325 | Tragic 13.0% |
| Colville | 0.0 /100 | #326 | Tragic 13.0% |
| Yakama | 0.0 /100 | #327 | Tragic 13.1% |
Demographics Similar to Immigrants from Sierra Leone by Family Poverty
In terms of family poverty, the demographic groups most similar to Immigrants from Sierra Leone are German Russian (9.4%, a difference of 0.040%), Immigrants from Lebanon (9.4%, a difference of 0.14%), Immigrants from Portugal (9.4%, a difference of 0.17%), Aleut (9.5%, a difference of 0.33%), and Immigrants from South America (9.5%, a difference of 0.34%).
| Demographics | Rating | Rank | Family Poverty |
| Venezuelans | 27.4 /100 | #195 | Fair 9.3% |
| Immigrants | Venezuela | 26.1 /100 | #196 | Fair 9.3% |
| Immigrants | Colombia | 24.4 /100 | #197 | Fair 9.3% |
| Iraqis | 24.2 /100 | #198 | Fair 9.3% |
| Spaniards | 22.8 /100 | #199 | Fair 9.4% |
| Immigrants | Costa Rica | 21.7 /100 | #200 | Fair 9.4% |
| Immigrants | Portugal | 20.5 /100 | #201 | Fair 9.4% |
| Immigrants | Sierra Leone | 19.6 /100 | #202 | Poor 9.4% |
| German Russians | 19.4 /100 | #203 | Poor 9.4% |
| Immigrants | Lebanon | 18.9 /100 | #204 | Poor 9.4% |
| Aleuts | 18.0 /100 | #205 | Poor 9.5% |
| Immigrants | South America | 18.0 /100 | #206 | Poor 9.5% |
| Sierra Leoneans | 15.6 /100 | #207 | Poor 9.5% |
| Immigrants | Eastern Africa | 15.1 /100 | #208 | Poor 9.5% |
| Immigrants | Uruguay | 14.0 /100 | #209 | Poor 9.5% |