Chickasaw vs Immigrants from Senegal Single Mother Poverty
COMPARE
Chickasaw
Immigrants from Senegal
Single Mother Poverty
Single Mother Poverty Comparison
Chickasaw
Immigrants from Senegal
34.4%
SINGLE MOTHER POVERTY
0.0/ 100
METRIC RATING
314th/ 347
METRIC RANK
31.5%
SINGLE MOTHER POVERTY
0.1/ 100
METRIC RATING
268th/ 347
METRIC RANK
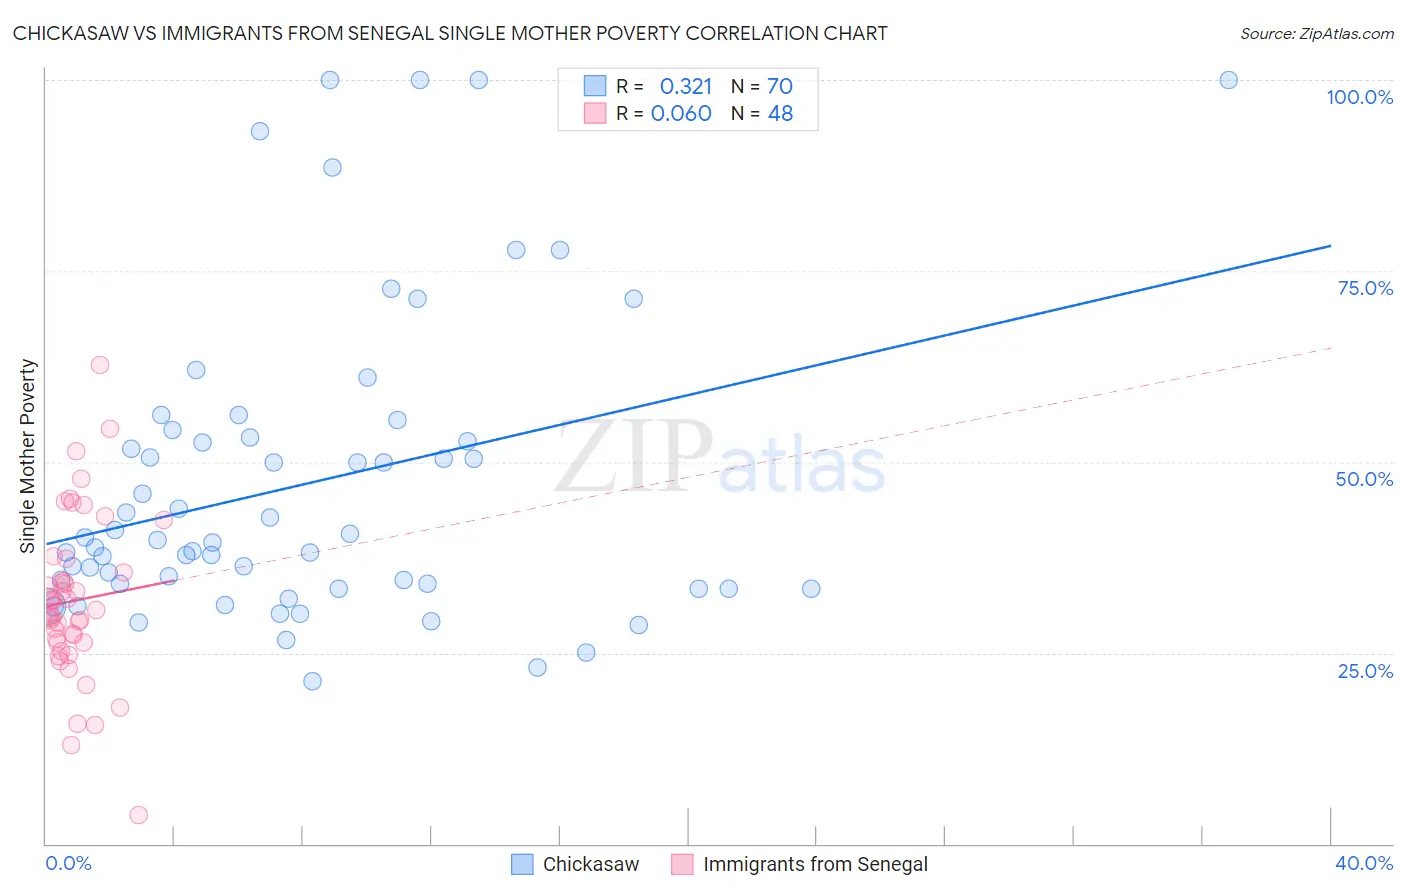
Chickasaw vs Immigrants from Senegal Single Mother Poverty Correlation Chart
The statistical analysis conducted on geographies consisting of 146,526,184 people shows a mild positive correlation between the proportion of Chickasaw and poverty level among single mothers in the United States with a correlation coefficient (R) of 0.321 and weighted average of 34.4%. Similarly, the statistical analysis conducted on geographies consisting of 89,735,175 people shows a slight positive correlation between the proportion of Immigrants from Senegal and poverty level among single mothers in the United States with a correlation coefficient (R) of 0.060 and weighted average of 31.5%, a difference of 9.4%.
Single Mother Poverty Correlation Summary
| Measurement | Chickasaw | Immigrants from Senegal |
| Minimum | 21.2% | 3.8% |
| Maximum | 100.0% | 62.7% |
| Range | 78.7% | 58.9% |
| Mean | 47.2% | 31.8% |
| Median | 39.6% | 30.4% |
| Interquartile 25% (IQ1) | 33.3% | 26.3% |
| Interquartile 75% (IQ3) | 53.2% | 36.4% |
| Interquartile Range (IQR) | 19.9% | 10.1% |
| Standard Deviation (Sample) | 20.0% | 10.9% |
| Standard Deviation (Population) | 19.8% | 10.8% |
Similar Demographics by Single Mother Poverty
Demographics Similar to Chickasaw by Single Mother Poverty
In terms of single mother poverty, the demographic groups most similar to Chickasaw are Hopi (34.5%, a difference of 0.080%), Immigrants from Dominican Republic (34.4%, a difference of 0.17%), Dominican (34.5%, a difference of 0.20%), Central American Indian (34.3%, a difference of 0.26%), and Cherokee (34.5%, a difference of 0.30%).
| Demographics | Rating | Rank | Single Mother Poverty |
| Comanche | 0.0 /100 | #307 | Tragic 33.9% |
| Immigrants | Mexico | 0.0 /100 | #308 | Tragic 34.0% |
| Potawatomi | 0.0 /100 | #309 | Tragic 34.1% |
| Hondurans | 0.0 /100 | #310 | Tragic 34.2% |
| Alsatians | 0.0 /100 | #311 | Tragic 34.3% |
| Central American Indians | 0.0 /100 | #312 | Tragic 34.3% |
| Immigrants | Dominican Republic | 0.0 /100 | #313 | Tragic 34.4% |
| Chickasaw | 0.0 /100 | #314 | Tragic 34.4% |
| Hopi | 0.0 /100 | #315 | Tragic 34.5% |
| Dominicans | 0.0 /100 | #316 | Tragic 34.5% |
| Cherokee | 0.0 /100 | #317 | Tragic 34.5% |
| Immigrants | Honduras | 0.0 /100 | #318 | Tragic 34.7% |
| Chippewa | 0.0 /100 | #319 | Tragic 34.8% |
| Iroquois | 0.0 /100 | #320 | Tragic 34.8% |
| Paiute | 0.0 /100 | #321 | Tragic 35.1% |
Demographics Similar to Immigrants from Senegal by Single Mother Poverty
In terms of single mother poverty, the demographic groups most similar to Immigrants from Senegal are Scotch-Irish (31.5%, a difference of 0.040%), British West Indian (31.5%, a difference of 0.090%), Immigrants from Belize (31.4%, a difference of 0.18%), Subsaharan African (31.4%, a difference of 0.33%), and Immigrants from Cabo Verde (31.6%, a difference of 0.33%).
| Demographics | Rating | Rank | Single Mother Poverty |
| Immigrants | El Salvador | 0.3 /100 | #261 | Tragic 31.2% |
| Hmong | 0.3 /100 | #262 | Tragic 31.2% |
| Bahamians | 0.2 /100 | #263 | Tragic 31.3% |
| Immigrants | Ecuador | 0.2 /100 | #264 | Tragic 31.3% |
| German Russians | 0.2 /100 | #265 | Tragic 31.3% |
| Sub-Saharan Africans | 0.2 /100 | #266 | Tragic 31.4% |
| Immigrants | Belize | 0.2 /100 | #267 | Tragic 31.4% |
| Immigrants | Senegal | 0.1 /100 | #268 | Tragic 31.5% |
| Scotch-Irish | 0.1 /100 | #269 | Tragic 31.5% |
| British West Indians | 0.1 /100 | #270 | Tragic 31.5% |
| Immigrants | Cabo Verde | 0.1 /100 | #271 | Tragic 31.6% |
| Immigrants | Micronesia | 0.1 /100 | #272 | Tragic 31.6% |
| Fijians | 0.1 /100 | #273 | Tragic 31.6% |
| Bangladeshis | 0.1 /100 | #274 | Tragic 31.7% |
| Central Americans | 0.1 /100 | #275 | Tragic 31.8% |