Immigrants from Dominican Republic vs Central American Indian Seniors Poverty Over the Age of 65
COMPARE
Immigrants from Dominican Republic
Central American Indian
Seniors Poverty Over the Age of 65
Seniors Poverty Over the Age of 65 Comparison
Immigrants from Dominican Republic
Central American Indians
18.3%
SENIORS POVERTY OVER THE AGE OF 65
0.0/ 100
METRIC RATING
344th/ 347
METRIC RANK
15.1%
SENIORS POVERTY OVER THE AGE OF 65
0.0/ 100
METRIC RATING
325th/ 347
METRIC RANK
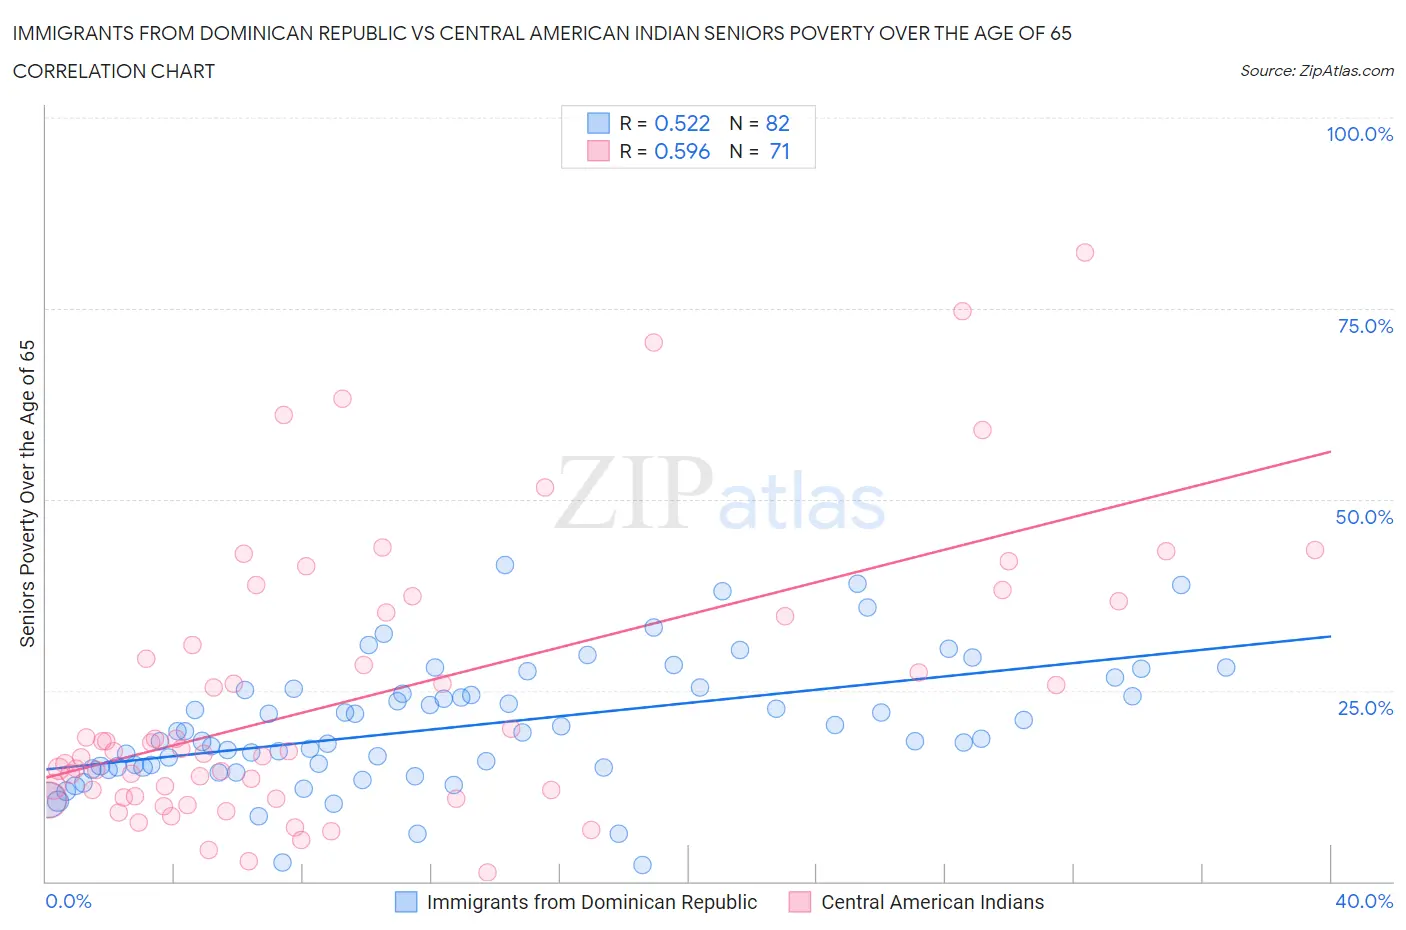
Immigrants from Dominican Republic vs Central American Indian Seniors Poverty Over the Age of 65 Correlation Chart
The statistical analysis conducted on geographies consisting of 274,160,985 people shows a substantial positive correlation between the proportion of Immigrants from Dominican Republic and poverty level among seniors over the age of 65 in the United States with a correlation coefficient (R) of 0.522 and weighted average of 18.3%. Similarly, the statistical analysis conducted on geographies consisting of 325,391,809 people shows a substantial positive correlation between the proportion of Central American Indians and poverty level among seniors over the age of 65 in the United States with a correlation coefficient (R) of 0.596 and weighted average of 15.1%, a difference of 21.2%.
Seniors Poverty Over the Age of 65 Correlation Summary
| Measurement | Immigrants from Dominican Republic | Central American Indian |
| Minimum | 2.2% | 1.1% |
| Maximum | 41.4% | 82.2% |
| Range | 39.2% | 81.1% |
| Mean | 20.3% | 24.1% |
| Median | 19.1% | 17.1% |
| Interquartile 25% (IQ1) | 14.9% | 11.2% |
| Interquartile 75% (IQ3) | 25.1% | 35.2% |
| Interquartile Range (IQR) | 10.2% | 24.1% |
| Standard Deviation (Sample) | 8.1% | 18.1% |
| Standard Deviation (Population) | 8.1% | 18.0% |
Demographics Similar to Immigrants from Dominican Republic and Central American Indians by Seniors Poverty Over the Age of 65
In terms of seniors poverty over the age of 65, the demographic groups most similar to Immigrants from Dominican Republic are Lumbee (18.1%, a difference of 0.90%), Immigrants from Cuba (17.9%, a difference of 2.0%), Dominican (17.8%, a difference of 2.5%), Hopi (17.8%, a difference of 2.9%), and Navajo (17.5%, a difference of 4.8%). Similarly, the demographic groups most similar to Central American Indians are Nicaraguan (15.0%, a difference of 0.59%), Immigrants from Armenia (15.2%, a difference of 0.60%), Crow (15.2%, a difference of 0.86%), Sioux (15.3%, a difference of 1.4%), and Immigrants from Dominica (15.5%, a difference of 2.5%).
| Demographics | Rating | Rank | Seniors Poverty Over the Age of 65 |
| Nicaraguans | 0.0 /100 | #324 | Tragic 15.0% |
| Central American Indians | 0.0 /100 | #325 | Tragic 15.1% |
| Immigrants | Armenia | 0.0 /100 | #326 | Tragic 15.2% |
| Crow | 0.0 /100 | #327 | Tragic 15.2% |
| Sioux | 0.0 /100 | #328 | Tragic 15.3% |
| Immigrants | Dominica | 0.0 /100 | #329 | Tragic 15.5% |
| Immigrants | St. Vincent and the Grenadines | 0.0 /100 | #330 | Tragic 15.5% |
| British West Indians | 0.0 /100 | #331 | Tragic 15.6% |
| Immigrants | Grenada | 0.0 /100 | #332 | Tragic 15.8% |
| Immigrants | Yemen | 0.0 /100 | #333 | Tragic 15.9% |
| Immigrants | Nicaragua | 0.0 /100 | #334 | Tragic 15.9% |
| Cubans | 0.0 /100 | #335 | Tragic 16.1% |
| Immigrants | Cabo Verde | 0.0 /100 | #336 | Tragic 16.2% |
| Immigrants | Caribbean | 0.0 /100 | #337 | Tragic 16.5% |
| Pueblo | 0.0 /100 | #338 | Tragic 17.2% |
| Navajo | 0.0 /100 | #339 | Tragic 17.5% |
| Hopi | 0.0 /100 | #340 | Tragic 17.8% |
| Dominicans | 0.0 /100 | #341 | Tragic 17.8% |
| Immigrants | Cuba | 0.0 /100 | #342 | Tragic 17.9% |
| Lumbee | 0.0 /100 | #343 | Tragic 18.1% |
| Immigrants | Dominican Republic | 0.0 /100 | #344 | Tragic 18.3% |