French Canadian vs Central American Indian Seniors Poverty Over the Age of 65
COMPARE
French Canadian
Central American Indian
Seniors Poverty Over the Age of 65
Seniors Poverty Over the Age of 65 Comparison
French Canadians
Central American Indians
9.8%
SENIORS POVERTY OVER THE AGE OF 65
98.9/ 100
METRIC RATING
62nd/ 347
METRIC RANK
15.1%
SENIORS POVERTY OVER THE AGE OF 65
0.0/ 100
METRIC RATING
325th/ 347
METRIC RANK
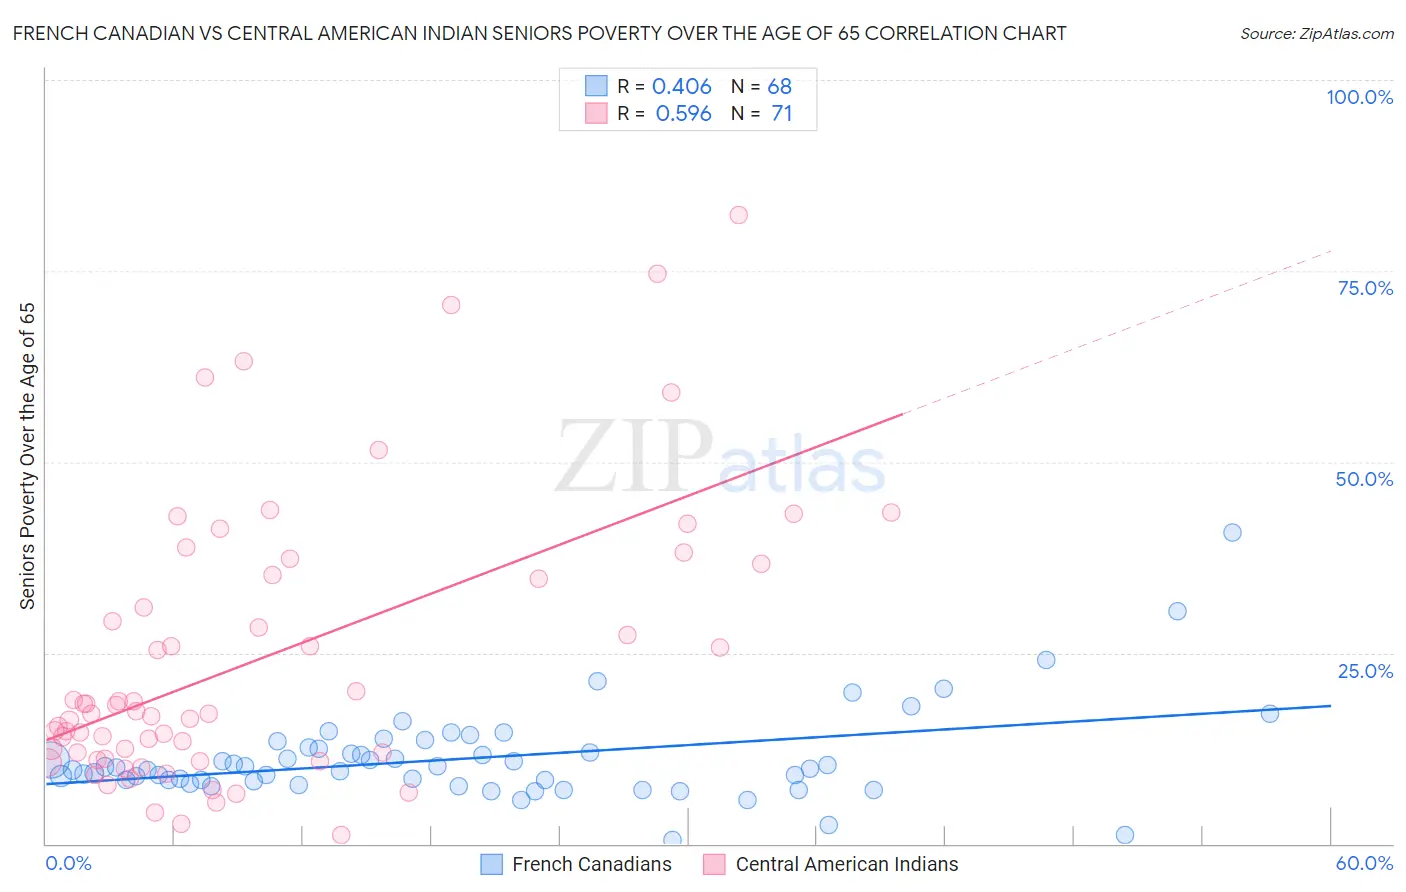
French Canadian vs Central American Indian Seniors Poverty Over the Age of 65 Correlation Chart
The statistical analysis conducted on geographies consisting of 499,603,433 people shows a moderate positive correlation between the proportion of French Canadians and poverty level among seniors over the age of 65 in the United States with a correlation coefficient (R) of 0.406 and weighted average of 9.8%. Similarly, the statistical analysis conducted on geographies consisting of 325,391,809 people shows a substantial positive correlation between the proportion of Central American Indians and poverty level among seniors over the age of 65 in the United States with a correlation coefficient (R) of 0.596 and weighted average of 15.1%, a difference of 53.4%.
Seniors Poverty Over the Age of 65 Correlation Summary
| Measurement | French Canadian | Central American Indian |
| Minimum | 0.55% | 1.1% |
| Maximum | 40.7% | 82.2% |
| Range | 40.2% | 81.1% |
| Mean | 11.2% | 24.1% |
| Median | 9.9% | 17.1% |
| Interquartile 25% (IQ1) | 8.3% | 11.2% |
| Interquartile 75% (IQ3) | 12.5% | 35.2% |
| Interquartile Range (IQR) | 4.2% | 24.1% |
| Standard Deviation (Sample) | 6.1% | 18.1% |
| Standard Deviation (Population) | 6.0% | 18.0% |
Similar Demographics by Seniors Poverty Over the Age of 65
Demographics Similar to French Canadians by Seniors Poverty Over the Age of 65
In terms of seniors poverty over the age of 65, the demographic groups most similar to French Canadians are Iranian (9.8%, a difference of 0.040%), Celtic (9.8%, a difference of 0.13%), Immigrants from Canada (9.8%, a difference of 0.16%), Macedonian (9.9%, a difference of 0.18%), and Immigrants from North America (9.9%, a difference of 0.23%).
| Demographics | Rating | Rank | Seniors Poverty Over the Age of 65 |
| Afghans | 99.2 /100 | #55 | Exceptional 9.8% |
| Immigrants | England | 99.1 /100 | #56 | Exceptional 9.8% |
| Bolivians | 99.1 /100 | #57 | Exceptional 9.8% |
| Serbians | 99.1 /100 | #58 | Exceptional 9.8% |
| Immigrants | Canada | 99.0 /100 | #59 | Exceptional 9.8% |
| Celtics | 99.0 /100 | #60 | Exceptional 9.8% |
| Iranians | 98.9 /100 | #61 | Exceptional 9.8% |
| French Canadians | 98.9 /100 | #62 | Exceptional 9.8% |
| Macedonians | 98.8 /100 | #63 | Exceptional 9.9% |
| Immigrants | North America | 98.8 /100 | #64 | Exceptional 9.9% |
| Pennsylvania Germans | 98.7 /100 | #65 | Exceptional 9.9% |
| Immigrants | Netherlands | 98.7 /100 | #66 | Exceptional 9.9% |
| Immigrants | Austria | 98.6 /100 | #67 | Exceptional 9.9% |
| Canadians | 98.5 /100 | #68 | Exceptional 9.9% |
| Australians | 98.4 /100 | #69 | Exceptional 9.9% |
Demographics Similar to Central American Indians by Seniors Poverty Over the Age of 65
In terms of seniors poverty over the age of 65, the demographic groups most similar to Central American Indians are Nicaraguan (15.0%, a difference of 0.59%), Immigrants from Armenia (15.2%, a difference of 0.60%), Crow (15.2%, a difference of 0.86%), Sioux (15.3%, a difference of 1.4%), and Yakama (14.8%, a difference of 2.0%).
| Demographics | Rating | Rank | Seniors Poverty Over the Age of 65 |
| Immigrants | Honduras | 0.0 /100 | #318 | Tragic 14.5% |
| Cape Verdeans | 0.0 /100 | #319 | Tragic 14.7% |
| Immigrants | Haiti | 0.0 /100 | #320 | Tragic 14.7% |
| Houma | 0.0 /100 | #321 | Tragic 14.7% |
| Immigrants | Barbados | 0.0 /100 | #322 | Tragic 14.8% |
| Yakama | 0.0 /100 | #323 | Tragic 14.8% |
| Nicaraguans | 0.0 /100 | #324 | Tragic 15.0% |
| Central American Indians | 0.0 /100 | #325 | Tragic 15.1% |
| Immigrants | Armenia | 0.0 /100 | #326 | Tragic 15.2% |
| Crow | 0.0 /100 | #327 | Tragic 15.2% |
| Sioux | 0.0 /100 | #328 | Tragic 15.3% |
| Immigrants | Dominica | 0.0 /100 | #329 | Tragic 15.5% |
| Immigrants | St. Vincent and the Grenadines | 0.0 /100 | #330 | Tragic 15.5% |
| British West Indians | 0.0 /100 | #331 | Tragic 15.6% |
| Immigrants | Grenada | 0.0 /100 | #332 | Tragic 15.8% |