Cheyenne vs Okinawan Single Male Poverty
COMPARE
Cheyenne
Okinawan
Single Male Poverty
Single Male Poverty Comparison
Cheyenne
Okinawans
16.1%
SINGLE MALE POVERTY
0.0/ 100
METRIC RATING
315th/ 347
METRIC RANK
12.6%
SINGLE MALE POVERTY
75.9/ 100
METRIC RATING
141st/ 347
METRIC RANK
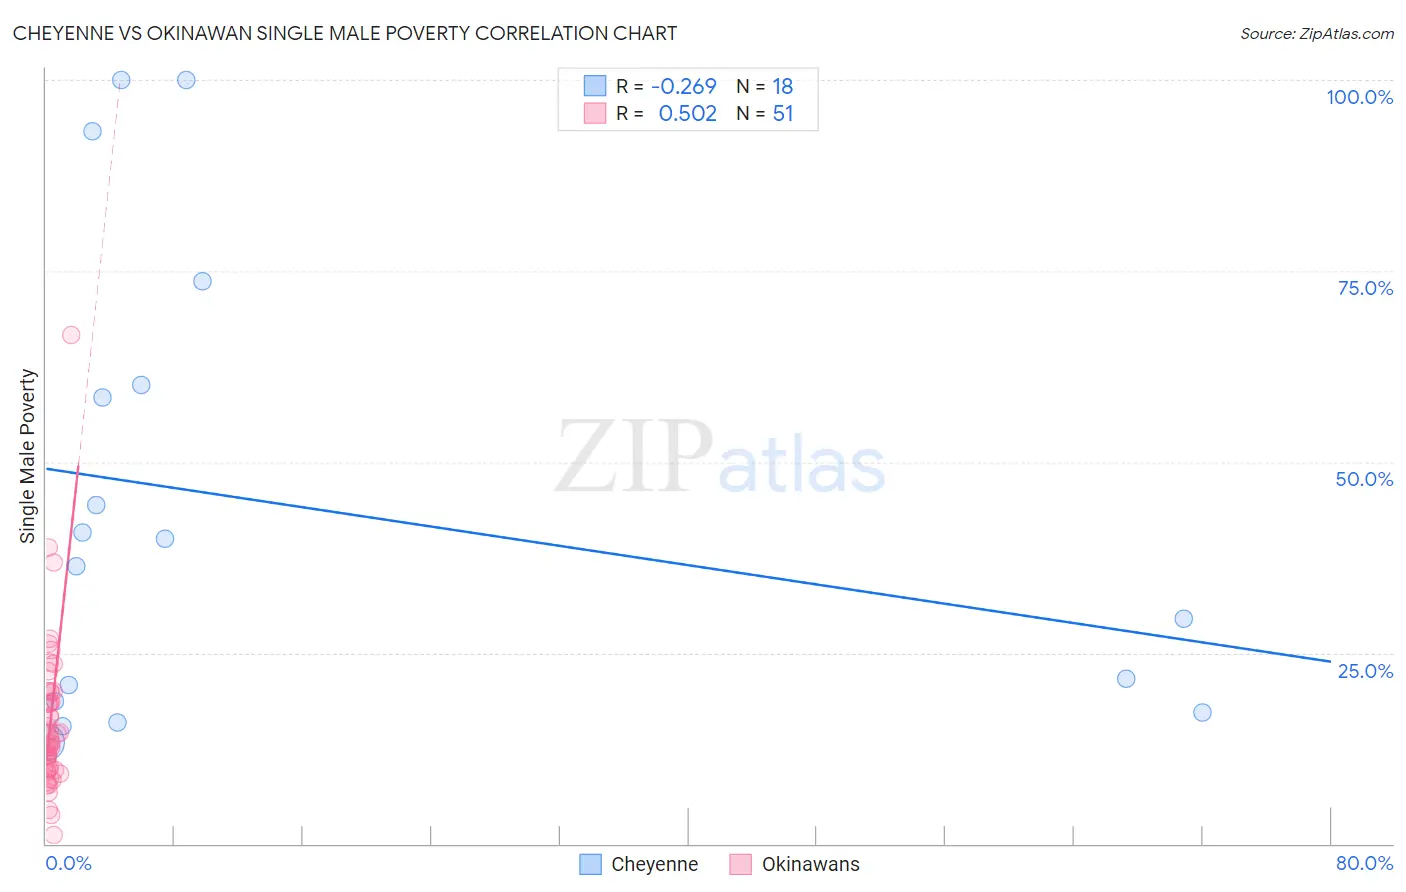
Cheyenne vs Okinawan Single Male Poverty Correlation Chart
The statistical analysis conducted on geographies consisting of 78,255,059 people shows a weak negative correlation between the proportion of Cheyenne and poverty level among single males in the United States with a correlation coefficient (R) of -0.269 and weighted average of 16.1%. Similarly, the statistical analysis conducted on geographies consisting of 71,206,320 people shows a substantial positive correlation between the proportion of Okinawans and poverty level among single males in the United States with a correlation coefficient (R) of 0.502 and weighted average of 12.6%, a difference of 27.8%.
Single Male Poverty Correlation Summary
| Measurement | Cheyenne | Okinawan |
| Minimum | 13.3% | 1.2% |
| Maximum | 100.0% | 66.7% |
| Range | 86.7% | 65.5% |
| Mean | 44.4% | 15.9% |
| Median | 38.2% | 13.2% |
| Interquartile 25% (IQ1) | 18.7% | 9.7% |
| Interquartile 75% (IQ3) | 60.0% | 19.8% |
| Interquartile Range (IQR) | 41.3% | 10.1% |
| Standard Deviation (Sample) | 30.0% | 10.4% |
| Standard Deviation (Population) | 29.1% | 10.3% |
Similar Demographics by Single Male Poverty
Demographics Similar to Cheyenne by Single Male Poverty
In terms of single male poverty, the demographic groups most similar to Cheyenne are Alaskan Athabascan (16.1%, a difference of 0.040%), Dutch West Indian (16.1%, a difference of 0.14%), Cherokee (16.1%, a difference of 0.33%), Black/African American (16.2%, a difference of 0.48%), and Comanche (16.0%, a difference of 0.56%).
| Demographics | Rating | Rank | Single Male Poverty |
| Potawatomi | 0.0 /100 | #308 | Tragic 15.8% |
| Americans | 0.0 /100 | #309 | Tragic 15.8% |
| Yakama | 0.0 /100 | #310 | Tragic 15.9% |
| Seminole | 0.0 /100 | #311 | Tragic 16.0% |
| Comanche | 0.0 /100 | #312 | Tragic 16.0% |
| Cherokee | 0.0 /100 | #313 | Tragic 16.1% |
| Alaskan Athabascans | 0.0 /100 | #314 | Tragic 16.1% |
| Cheyenne | 0.0 /100 | #315 | Tragic 16.1% |
| Dutch West Indians | 0.0 /100 | #316 | Tragic 16.1% |
| Blacks/African Americans | 0.0 /100 | #317 | Tragic 16.2% |
| Chickasaw | 0.0 /100 | #318 | Tragic 16.3% |
| Chippewa | 0.0 /100 | #319 | Tragic 16.4% |
| Marshallese | 0.0 /100 | #320 | Tragic 16.4% |
| Osage | 0.0 /100 | #321 | Tragic 16.5% |
| Shoshone | 0.0 /100 | #322 | Tragic 16.7% |
Demographics Similar to Okinawans by Single Male Poverty
In terms of single male poverty, the demographic groups most similar to Okinawans are Immigrants from Uganda (12.6%, a difference of 0.0%), Immigrants from France (12.6%, a difference of 0.010%), Hawaiian (12.6%, a difference of 0.060%), Immigrants from Lebanon (12.6%, a difference of 0.070%), and Native Hawaiian (12.6%, a difference of 0.070%).
| Demographics | Rating | Rank | Single Male Poverty |
| Immigrants | Ecuador | 82.1 /100 | #134 | Excellent 12.5% |
| Immigrants | Costa Rica | 81.9 /100 | #135 | Excellent 12.5% |
| Immigrants | Austria | 81.9 /100 | #136 | Excellent 12.5% |
| Ukrainians | 80.7 /100 | #137 | Excellent 12.6% |
| Immigrants | El Salvador | 80.0 /100 | #138 | Excellent 12.6% |
| Cubans | 79.9 /100 | #139 | Good 12.6% |
| Immigrants | Zimbabwe | 78.0 /100 | #140 | Good 12.6% |
| Okinawans | 75.9 /100 | #141 | Good 12.6% |
| Immigrants | Uganda | 75.9 /100 | #142 | Good 12.6% |
| Immigrants | France | 75.8 /100 | #143 | Good 12.6% |
| Hawaiians | 75.1 /100 | #144 | Good 12.6% |
| Immigrants | Lebanon | 75.0 /100 | #145 | Good 12.6% |
| Native Hawaiians | 75.0 /100 | #146 | Good 12.6% |
| Malaysians | 74.8 /100 | #147 | Good 12.6% |
| Yugoslavians | 73.9 /100 | #148 | Good 12.6% |