Dutch vs Immigrants from Honduras Single Male Poverty
COMPARE
Dutch
Immigrants from Honduras
Single Male Poverty
Single Male Poverty Comparison
Dutch
Immigrants from Honduras
14.1%
SINGLE MALE POVERTY
0.1/ 100
METRIC RATING
276th/ 347
METRIC RANK
14.1%
SINGLE MALE POVERTY
0.0/ 100
METRIC RATING
277th/ 347
METRIC RANK
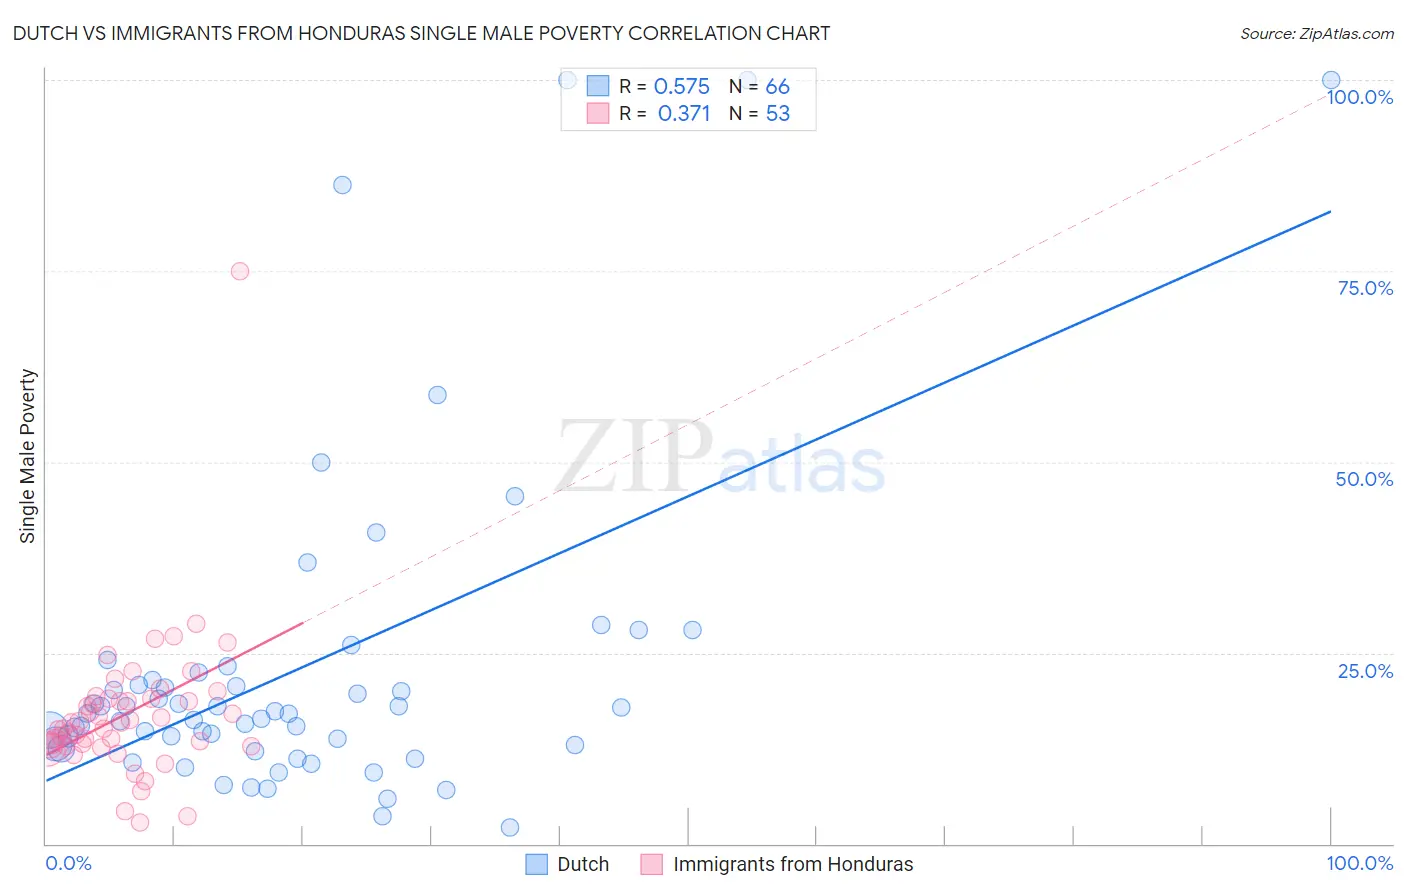
Dutch vs Immigrants from Honduras Single Male Poverty Correlation Chart
The statistical analysis conducted on geographies consisting of 460,167,982 people shows a substantial positive correlation between the proportion of Dutch and poverty level among single males in the United States with a correlation coefficient (R) of 0.575 and weighted average of 14.1%. Similarly, the statistical analysis conducted on geographies consisting of 297,868,634 people shows a mild positive correlation between the proportion of Immigrants from Honduras and poverty level among single males in the United States with a correlation coefficient (R) of 0.371 and weighted average of 14.1%, a difference of 0.040%.
Single Male Poverty Correlation Summary
| Measurement | Dutch | Immigrants from Honduras |
| Minimum | 2.1% | 2.8% |
| Maximum | 100.0% | 75.0% |
| Range | 97.9% | 72.2% |
| Mean | 22.9% | 16.9% |
| Median | 17.0% | 15.8% |
| Interquartile 25% (IQ1) | 12.8% | 12.8% |
| Interquartile 75% (IQ3) | 21.5% | 19.0% |
| Interquartile Range (IQR) | 8.6% | 6.2% |
| Standard Deviation (Sample) | 21.4% | 9.9% |
| Standard Deviation (Population) | 21.2% | 9.8% |
Demographics Similar to Dutch and Immigrants from Honduras by Single Male Poverty
In terms of single male poverty, the demographic groups most similar to Dutch are Slovak (14.1%, a difference of 0.10%), English (14.1%, a difference of 0.12%), Indonesian (14.1%, a difference of 0.14%), Honduran (14.0%, a difference of 0.19%), and Welsh (14.0%, a difference of 0.32%). Similarly, the demographic groups most similar to Immigrants from Honduras are Slovak (14.1%, a difference of 0.060%), Indonesian (14.1%, a difference of 0.10%), English (14.1%, a difference of 0.16%), Honduran (14.0%, a difference of 0.23%), and Welsh (14.0%, a difference of 0.36%).
| Demographics | Rating | Rank | Single Male Poverty |
| Immigrants | Cabo Verde | 0.1 /100 | #266 | Tragic 13.9% |
| Germans | 0.1 /100 | #267 | Tragic 13.9% |
| Immigrants | Mexico | 0.1 /100 | #268 | Tragic 13.9% |
| Scottish | 0.1 /100 | #269 | Tragic 14.0% |
| Immigrants | Saudi Arabia | 0.1 /100 | #270 | Tragic 14.0% |
| Irish | 0.1 /100 | #271 | Tragic 14.0% |
| Mexicans | 0.1 /100 | #272 | Tragic 14.0% |
| Welsh | 0.1 /100 | #273 | Tragic 14.0% |
| Hondurans | 0.1 /100 | #274 | Tragic 14.0% |
| English | 0.1 /100 | #275 | Tragic 14.1% |
| Dutch | 0.1 /100 | #276 | Tragic 14.1% |
| Immigrants | Honduras | 0.0 /100 | #277 | Tragic 14.1% |
| Slovaks | 0.0 /100 | #278 | Tragic 14.1% |
| Indonesians | 0.0 /100 | #279 | Tragic 14.1% |
| Hmong | 0.0 /100 | #280 | Tragic 14.2% |
| Hispanics or Latinos | 0.0 /100 | #281 | Tragic 14.2% |
| Spanish Americans | 0.0 /100 | #282 | Tragic 14.2% |
| Yaqui | 0.0 /100 | #283 | Tragic 14.2% |
| Immigrants | Bahamas | 0.0 /100 | #284 | Tragic 14.4% |
| French | 0.0 /100 | #285 | Tragic 14.4% |
| Celtics | 0.0 /100 | #286 | Tragic 14.5% |