Immigrants from Moldova vs Pennsylvania German Single Mother Poverty
COMPARE
Immigrants from Moldova
Pennsylvania German
Single Mother Poverty
Single Mother Poverty Comparison
Immigrants from Moldova
Pennsylvania Germans
26.2%
SINGLE MOTHER POVERTY
100.0/ 100
METRIC RATING
24th/ 347
METRIC RANK
33.2%
SINGLE MOTHER POVERTY
0.0/ 100
METRIC RATING
297th/ 347
METRIC RANK
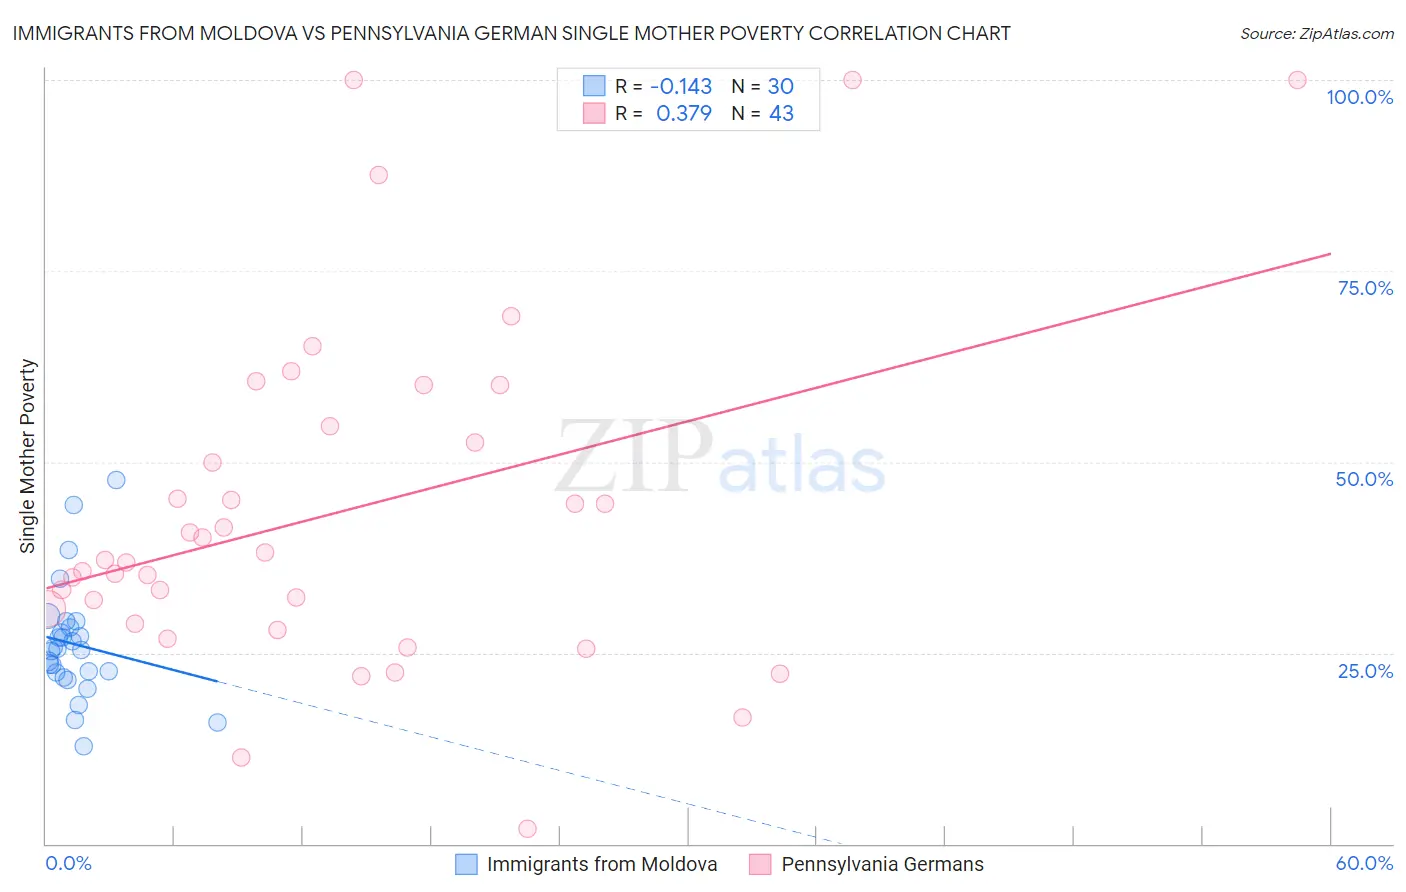
Immigrants from Moldova vs Pennsylvania German Single Mother Poverty Correlation Chart
The statistical analysis conducted on geographies consisting of 123,037,765 people shows a poor negative correlation between the proportion of Immigrants from Moldova and poverty level among single mothers in the United States with a correlation coefficient (R) of -0.143 and weighted average of 26.2%. Similarly, the statistical analysis conducted on geographies consisting of 229,321,350 people shows a mild positive correlation between the proportion of Pennsylvania Germans and poverty level among single mothers in the United States with a correlation coefficient (R) of 0.379 and weighted average of 33.2%, a difference of 26.6%.
Single Mother Poverty Correlation Summary
| Measurement | Immigrants from Moldova | Pennsylvania German |
| Minimum | 12.8% | 1.9% |
| Maximum | 47.6% | 100.0% |
| Range | 34.8% | 98.1% |
| Mean | 26.1% | 43.4% |
| Median | 25.4% | 37.2% |
| Interquartile 25% (IQ1) | 22.4% | 28.9% |
| Interquartile 75% (IQ3) | 28.4% | 54.6% |
| Interquartile Range (IQR) | 5.9% | 25.7% |
| Standard Deviation (Sample) | 7.5% | 22.5% |
| Standard Deviation (Population) | 7.4% | 22.3% |
Similar Demographics by Single Mother Poverty
Demographics Similar to Immigrants from Moldova by Single Mother Poverty
In terms of single mother poverty, the demographic groups most similar to Immigrants from Moldova are Burmese (26.2%, a difference of 0.020%), Immigrants from Asia (26.3%, a difference of 0.19%), Immigrants from Korea (26.2%, a difference of 0.20%), Immigrants from Sri Lanka (26.3%, a difference of 0.32%), and Immigrants from Bolivia (26.2%, a difference of 0.37%).
| Demographics | Rating | Rank | Single Mother Poverty |
| Asians | 100.0 /100 | #17 | Exceptional 26.0% |
| Immigrants | Pakistan | 100.0 /100 | #18 | Exceptional 26.0% |
| Immigrants | Eastern Asia | 100.0 /100 | #19 | Exceptional 26.1% |
| Immigrants | China | 100.0 /100 | #20 | Exceptional 26.1% |
| Immigrants | Bolivia | 100.0 /100 | #21 | Exceptional 26.2% |
| Immigrants | Korea | 100.0 /100 | #22 | Exceptional 26.2% |
| Burmese | 100.0 /100 | #23 | Exceptional 26.2% |
| Immigrants | Moldova | 100.0 /100 | #24 | Exceptional 26.2% |
| Immigrants | Asia | 100.0 /100 | #25 | Exceptional 26.3% |
| Immigrants | Sri Lanka | 100.0 /100 | #26 | Exceptional 26.3% |
| Immigrants | Japan | 100.0 /100 | #27 | Exceptional 26.4% |
| Koreans | 100.0 /100 | #28 | Exceptional 26.4% |
| Jordanians | 100.0 /100 | #29 | Exceptional 26.4% |
| Turks | 100.0 /100 | #30 | Exceptional 26.4% |
| Immigrants | Philippines | 100.0 /100 | #31 | Exceptional 26.5% |
Demographics Similar to Pennsylvania Germans by Single Mother Poverty
In terms of single mother poverty, the demographic groups most similar to Pennsylvania Germans are African (33.3%, a difference of 0.11%), Blackfeet (33.2%, a difference of 0.14%), Immigrants from Guatemala (33.3%, a difference of 0.20%), Hispanic or Latino (33.3%, a difference of 0.20%), and Yaqui (33.1%, a difference of 0.30%).
| Demographics | Rating | Rank | Single Mother Poverty |
| Osage | 0.0 /100 | #290 | Tragic 32.6% |
| Guatemalans | 0.0 /100 | #291 | Tragic 32.9% |
| Shoshone | 0.0 /100 | #292 | Tragic 32.9% |
| Aleuts | 0.0 /100 | #293 | Tragic 32.9% |
| French American Indians | 0.0 /100 | #294 | Tragic 33.1% |
| Yaqui | 0.0 /100 | #295 | Tragic 33.1% |
| Blackfeet | 0.0 /100 | #296 | Tragic 33.2% |
| Pennsylvania Germans | 0.0 /100 | #297 | Tragic 33.2% |
| Africans | 0.0 /100 | #298 | Tragic 33.3% |
| Immigrants | Guatemala | 0.0 /100 | #299 | Tragic 33.3% |
| Hispanics or Latinos | 0.0 /100 | #300 | Tragic 33.3% |
| Immigrants | Somalia | 0.0 /100 | #301 | Tragic 33.4% |
| Arapaho | 0.0 /100 | #302 | Tragic 33.4% |
| Americans | 0.0 /100 | #303 | Tragic 33.5% |
| Mexicans | 0.0 /100 | #304 | Tragic 33.6% |