Immigrants from Nigeria vs Pennsylvania German Single Mother Poverty
COMPARE
Immigrants from Nigeria
Pennsylvania German
Single Mother Poverty
Single Mother Poverty Comparison
Immigrants from Nigeria
Pennsylvania Germans
28.9%
SINGLE MOTHER POVERTY
65.9/ 100
METRIC RATING
163rd/ 347
METRIC RANK
33.2%
SINGLE MOTHER POVERTY
0.0/ 100
METRIC RATING
297th/ 347
METRIC RANK
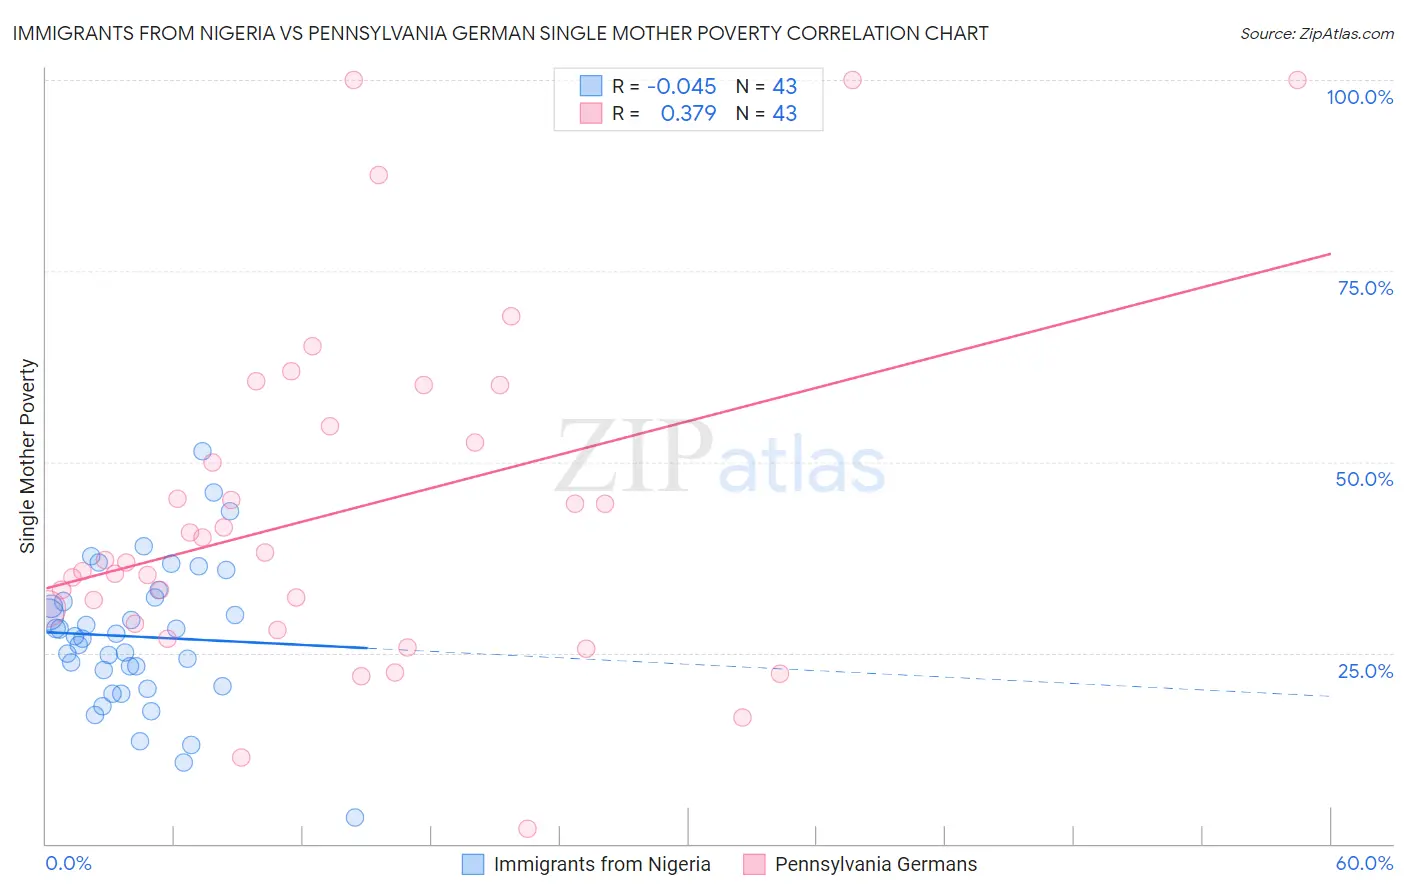
Immigrants from Nigeria vs Pennsylvania German Single Mother Poverty Correlation Chart
The statistical analysis conducted on geographies consisting of 280,043,423 people shows no correlation between the proportion of Immigrants from Nigeria and poverty level among single mothers in the United States with a correlation coefficient (R) of -0.045 and weighted average of 28.9%. Similarly, the statistical analysis conducted on geographies consisting of 229,321,350 people shows a mild positive correlation between the proportion of Pennsylvania Germans and poverty level among single mothers in the United States with a correlation coefficient (R) of 0.379 and weighted average of 33.2%, a difference of 14.9%.
Single Mother Poverty Correlation Summary
| Measurement | Immigrants from Nigeria | Pennsylvania German |
| Minimum | 3.4% | 1.9% |
| Maximum | 51.4% | 100.0% |
| Range | 47.9% | 98.1% |
| Mean | 27.1% | 43.4% |
| Median | 27.2% | 37.2% |
| Interquartile 25% (IQ1) | 20.7% | 28.9% |
| Interquartile 75% (IQ3) | 32.3% | 54.6% |
| Interquartile Range (IQR) | 11.7% | 25.7% |
| Standard Deviation (Sample) | 9.4% | 22.5% |
| Standard Deviation (Population) | 9.3% | 22.3% |
Similar Demographics by Single Mother Poverty
Demographics Similar to Immigrants from Nigeria by Single Mother Poverty
In terms of single mother poverty, the demographic groups most similar to Immigrants from Nigeria are Immigrants from Kenya (28.9%, a difference of 0.0%), Scandinavian (28.9%, a difference of 0.020%), Immigrants from Cambodia (28.9%, a difference of 0.040%), Japanese (28.9%, a difference of 0.11%), and Czech (28.9%, a difference of 0.14%).
| Demographics | Rating | Rank | Single Mother Poverty |
| Iraqis | 71.5 /100 | #156 | Good 28.8% |
| Immigrants | Western Europe | 71.1 /100 | #157 | Good 28.9% |
| Immigrants | Hungary | 70.6 /100 | #158 | Good 28.9% |
| Czechs | 68.4 /100 | #159 | Good 28.9% |
| Japanese | 68.0 /100 | #160 | Good 28.9% |
| Immigrants | Cambodia | 66.6 /100 | #161 | Good 28.9% |
| Scandinavians | 66.2 /100 | #162 | Good 28.9% |
| Immigrants | Nigeria | 65.9 /100 | #163 | Good 28.9% |
| Immigrants | Kenya | 65.9 /100 | #164 | Good 28.9% |
| Arabs | 60.7 /100 | #165 | Good 29.0% |
| Inupiat | 60.4 /100 | #166 | Good 29.0% |
| Costa Ricans | 58.4 /100 | #167 | Average 29.0% |
| Europeans | 57.6 /100 | #168 | Average 29.1% |
| Immigrants | Uruguay | 57.2 /100 | #169 | Average 29.1% |
| New Zealanders | 55.1 /100 | #170 | Average 29.1% |
Demographics Similar to Pennsylvania Germans by Single Mother Poverty
In terms of single mother poverty, the demographic groups most similar to Pennsylvania Germans are African (33.3%, a difference of 0.11%), Blackfeet (33.2%, a difference of 0.14%), Immigrants from Guatemala (33.3%, a difference of 0.20%), Hispanic or Latino (33.3%, a difference of 0.20%), and Yaqui (33.1%, a difference of 0.30%).
| Demographics | Rating | Rank | Single Mother Poverty |
| Osage | 0.0 /100 | #290 | Tragic 32.6% |
| Guatemalans | 0.0 /100 | #291 | Tragic 32.9% |
| Shoshone | 0.0 /100 | #292 | Tragic 32.9% |
| Aleuts | 0.0 /100 | #293 | Tragic 32.9% |
| French American Indians | 0.0 /100 | #294 | Tragic 33.1% |
| Yaqui | 0.0 /100 | #295 | Tragic 33.1% |
| Blackfeet | 0.0 /100 | #296 | Tragic 33.2% |
| Pennsylvania Germans | 0.0 /100 | #297 | Tragic 33.2% |
| Africans | 0.0 /100 | #298 | Tragic 33.3% |
| Immigrants | Guatemala | 0.0 /100 | #299 | Tragic 33.3% |
| Hispanics or Latinos | 0.0 /100 | #300 | Tragic 33.3% |
| Immigrants | Somalia | 0.0 /100 | #301 | Tragic 33.4% |
| Arapaho | 0.0 /100 | #302 | Tragic 33.4% |
| Americans | 0.0 /100 | #303 | Tragic 33.5% |
| Mexicans | 0.0 /100 | #304 | Tragic 33.6% |