Central American vs Mongolian Child Poverty Under the Age of 5
COMPARE
Central American
Mongolian
Child Poverty Under the Age of 5
Child Poverty Under the Age of 5 Comparison
Central Americans
Mongolians
20.6%
CHILD POVERTY UNDER THE AGE OF 5
0.1/ 100
METRIC RATING
273rd/ 347
METRIC RANK
16.1%
CHILD POVERTY UNDER THE AGE OF 5
92.5/ 100
METRIC RATING
121st/ 347
METRIC RANK
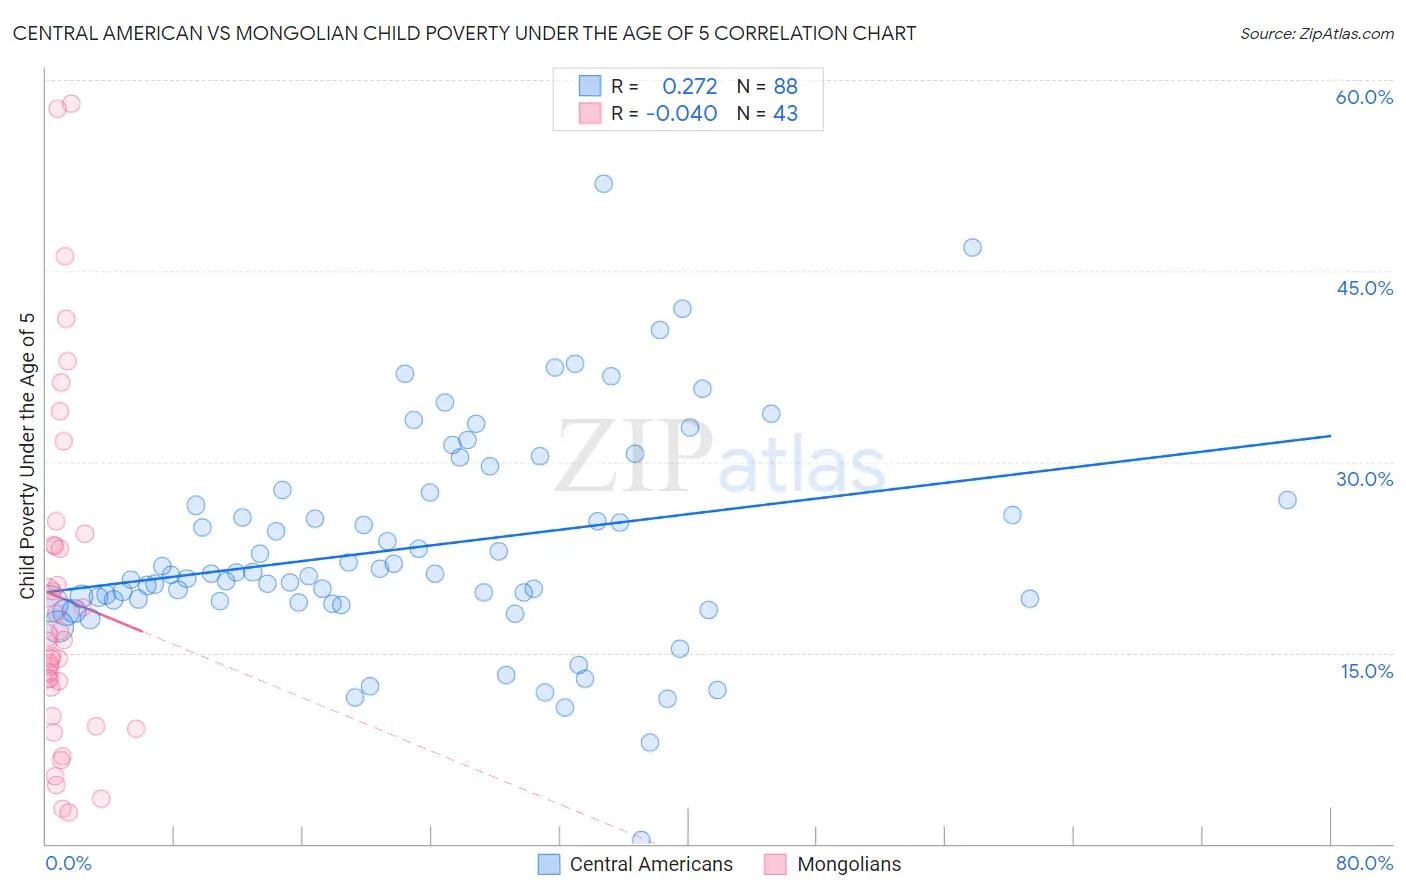
Central American vs Mongolian Child Poverty Under the Age of 5 Correlation Chart
The statistical analysis conducted on geographies consisting of 480,879,905 people shows a weak positive correlation between the proportion of Central Americans and poverty level among children under the age of 5 in the United States with a correlation coefficient (R) of 0.272 and weighted average of 20.6%. Similarly, the statistical analysis conducted on geographies consisting of 138,133,739 people shows no correlation between the proportion of Mongolians and poverty level among children under the age of 5 in the United States with a correlation coefficient (R) of -0.040 and weighted average of 16.1%, a difference of 27.9%.
Child Poverty Under the Age of 5 Correlation Summary
| Measurement | Central American | Mongolian |
| Minimum | 0.31% | 2.4% |
| Maximum | 51.8% | 58.2% |
| Range | 51.5% | 55.7% |
| Mean | 23.3% | 19.3% |
| Median | 21.2% | 15.9% |
| Interquartile 25% (IQ1) | 19.0% | 10.0% |
| Interquartile 75% (IQ3) | 27.3% | 23.5% |
| Interquartile Range (IQR) | 8.3% | 13.5% |
| Standard Deviation (Sample) | 8.5% | 13.5% |
| Standard Deviation (Population) | 8.5% | 13.3% |
Similar Demographics by Child Poverty Under the Age of 5
Demographics Similar to Central Americans by Child Poverty Under the Age of 5
In terms of child poverty under the age of 5, the demographic groups most similar to Central Americans are Immigrants from Belize (20.6%, a difference of 0.10%), Bangladeshi (20.6%, a difference of 0.15%), West Indian (20.6%, a difference of 0.24%), Immigrants from West Indies (20.7%, a difference of 0.41%), and Immigrants from Grenada (20.7%, a difference of 0.43%).
| Demographics | Rating | Rank | Child Poverty Under the Age of 5 |
| Aleuts | 0.1 /100 | #266 | Tragic 20.3% |
| Ottawa | 0.1 /100 | #267 | Tragic 20.3% |
| Belizeans | 0.1 /100 | #268 | Tragic 20.3% |
| Immigrants | Burma/Myanmar | 0.1 /100 | #269 | Tragic 20.4% |
| Jamaicans | 0.1 /100 | #270 | Tragic 20.4% |
| Americans | 0.1 /100 | #271 | Tragic 20.5% |
| Immigrants | Jamaica | 0.1 /100 | #272 | Tragic 20.5% |
| Central Americans | 0.1 /100 | #273 | Tragic 20.6% |
| Immigrants | Belize | 0.1 /100 | #274 | Tragic 20.6% |
| Bangladeshis | 0.1 /100 | #275 | Tragic 20.6% |
| West Indians | 0.0 /100 | #276 | Tragic 20.6% |
| Immigrants | West Indies | 0.0 /100 | #277 | Tragic 20.7% |
| Immigrants | Grenada | 0.0 /100 | #278 | Tragic 20.7% |
| Sub-Saharan Africans | 0.0 /100 | #279 | Tragic 20.8% |
| French American Indians | 0.0 /100 | #280 | Tragic 20.8% |
Demographics Similar to Mongolians by Child Poverty Under the Age of 5
In terms of child poverty under the age of 5, the demographic groups most similar to Mongolians are Immigrants from Peru (16.1%, a difference of 0.010%), Immigrants from Southern Europe (16.1%, a difference of 0.20%), Austrian (16.1%, a difference of 0.22%), Swiss (16.1%, a difference of 0.23%), and Immigrants from Jordan (16.1%, a difference of 0.27%).
| Demographics | Rating | Rank | Child Poverty Under the Age of 5 |
| Immigrants | Kuwait | 93.9 /100 | #114 | Exceptional 16.0% |
| Albanians | 93.8 /100 | #115 | Exceptional 16.0% |
| Immigrants | Austria | 93.5 /100 | #116 | Exceptional 16.0% |
| Basques | 93.4 /100 | #117 | Exceptional 16.0% |
| Immigrants | Denmark | 93.4 /100 | #118 | Exceptional 16.0% |
| Immigrants | Jordan | 93.2 /100 | #119 | Exceptional 16.1% |
| Immigrants | Peru | 92.6 /100 | #120 | Exceptional 16.1% |
| Mongolians | 92.5 /100 | #121 | Exceptional 16.1% |
| Immigrants | Southern Europe | 92.0 /100 | #122 | Exceptional 16.1% |
| Austrians | 92.0 /100 | #123 | Exceptional 16.1% |
| Swiss | 92.0 /100 | #124 | Exceptional 16.1% |
| Native Hawaiians | 91.8 /100 | #125 | Exceptional 16.2% |
| Immigrants | Albania | 91.8 /100 | #126 | Exceptional 16.2% |
| Immigrants | England | 91.5 /100 | #127 | Exceptional 16.2% |
| South Africans | 90.1 /100 | #128 | Exceptional 16.2% |