Central American vs Immigrants from Eastern Europe Child Poverty Under the Age of 5
COMPARE
Central American
Immigrants from Eastern Europe
Child Poverty Under the Age of 5
Child Poverty Under the Age of 5 Comparison
Central Americans
Immigrants from Eastern Europe
20.6%
CHILD POVERTY UNDER THE AGE OF 5
0.1/ 100
METRIC RATING
273rd/ 347
METRIC RANK
15.1%
CHILD POVERTY UNDER THE AGE OF 5
99.1/ 100
METRIC RATING
62nd/ 347
METRIC RANK
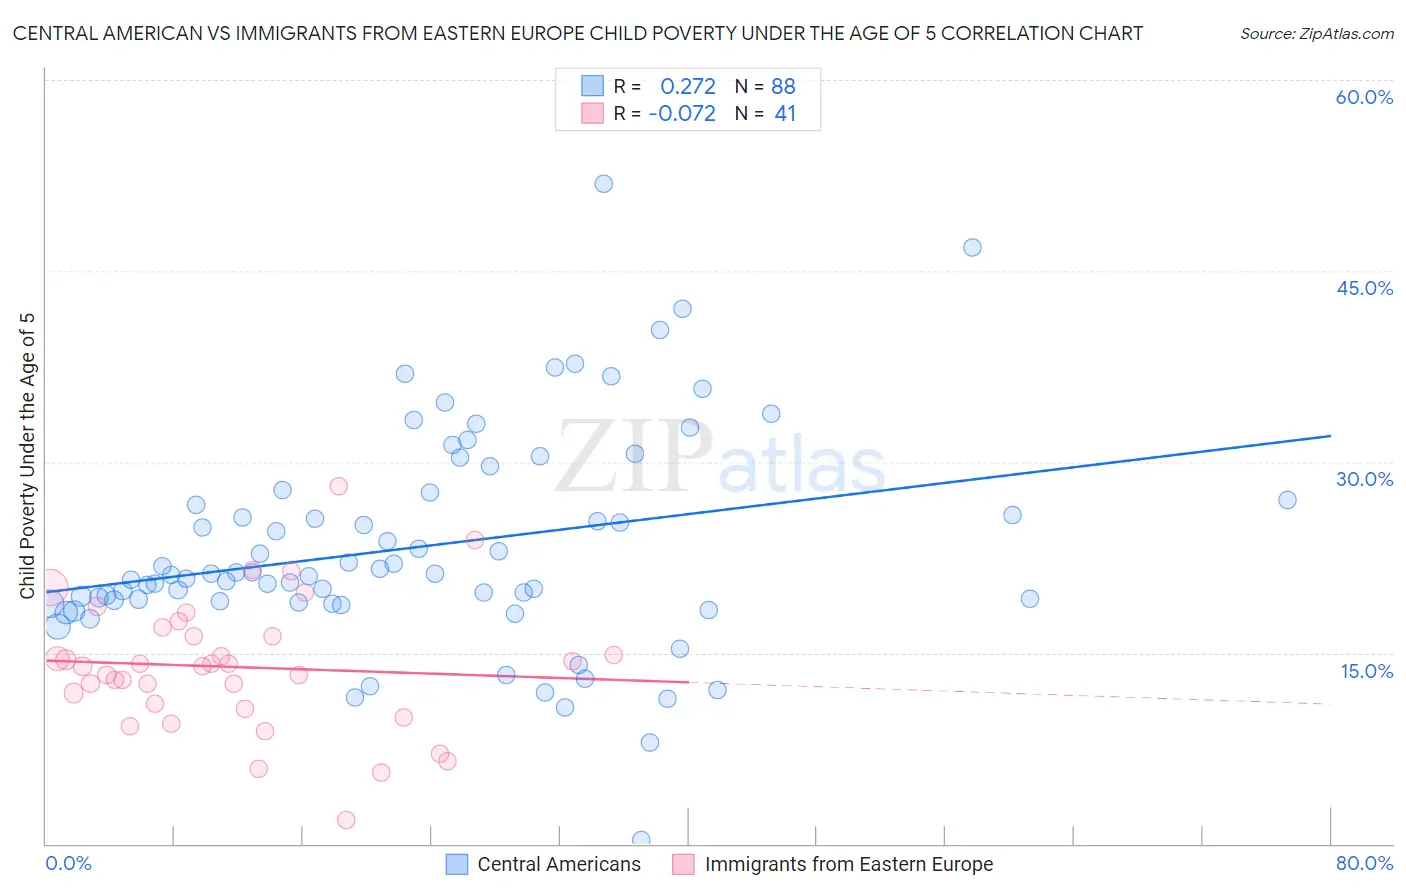
Central American vs Immigrants from Eastern Europe Child Poverty Under the Age of 5 Correlation Chart
The statistical analysis conducted on geographies consisting of 480,879,905 people shows a weak positive correlation between the proportion of Central Americans and poverty level among children under the age of 5 in the United States with a correlation coefficient (R) of 0.272 and weighted average of 20.6%. Similarly, the statistical analysis conducted on geographies consisting of 448,928,645 people shows a slight negative correlation between the proportion of Immigrants from Eastern Europe and poverty level among children under the age of 5 in the United States with a correlation coefficient (R) of -0.072 and weighted average of 15.1%, a difference of 36.1%.
Child Poverty Under the Age of 5 Correlation Summary
| Measurement | Central American | Immigrants from Eastern Europe |
| Minimum | 0.31% | 1.8% |
| Maximum | 51.8% | 28.1% |
| Range | 51.5% | 26.2% |
| Mean | 23.3% | 13.9% |
| Median | 21.2% | 13.9% |
| Interquartile 25% (IQ1) | 19.0% | 10.8% |
| Interquartile 75% (IQ3) | 27.3% | 16.7% |
| Interquartile Range (IQR) | 8.3% | 5.9% |
| Standard Deviation (Sample) | 8.5% | 5.2% |
| Standard Deviation (Population) | 8.5% | 5.1% |
Similar Demographics by Child Poverty Under the Age of 5
Demographics Similar to Central Americans by Child Poverty Under the Age of 5
In terms of child poverty under the age of 5, the demographic groups most similar to Central Americans are Immigrants from Belize (20.6%, a difference of 0.10%), Bangladeshi (20.6%, a difference of 0.15%), West Indian (20.6%, a difference of 0.24%), Immigrants from West Indies (20.7%, a difference of 0.41%), and Immigrants from Grenada (20.7%, a difference of 0.43%).
| Demographics | Rating | Rank | Child Poverty Under the Age of 5 |
| Aleuts | 0.1 /100 | #266 | Tragic 20.3% |
| Ottawa | 0.1 /100 | #267 | Tragic 20.3% |
| Belizeans | 0.1 /100 | #268 | Tragic 20.3% |
| Immigrants | Burma/Myanmar | 0.1 /100 | #269 | Tragic 20.4% |
| Jamaicans | 0.1 /100 | #270 | Tragic 20.4% |
| Americans | 0.1 /100 | #271 | Tragic 20.5% |
| Immigrants | Jamaica | 0.1 /100 | #272 | Tragic 20.5% |
| Central Americans | 0.1 /100 | #273 | Tragic 20.6% |
| Immigrants | Belize | 0.1 /100 | #274 | Tragic 20.6% |
| Bangladeshis | 0.1 /100 | #275 | Tragic 20.6% |
| West Indians | 0.0 /100 | #276 | Tragic 20.6% |
| Immigrants | West Indies | 0.0 /100 | #277 | Tragic 20.7% |
| Immigrants | Grenada | 0.0 /100 | #278 | Tragic 20.7% |
| Sub-Saharan Africans | 0.0 /100 | #279 | Tragic 20.8% |
| French American Indians | 0.0 /100 | #280 | Tragic 20.8% |
Demographics Similar to Immigrants from Eastern Europe by Child Poverty Under the Age of 5
In terms of child poverty under the age of 5, the demographic groups most similar to Immigrants from Eastern Europe are Immigrants from Poland (15.1%, a difference of 0.12%), Immigrants from Europe (15.1%, a difference of 0.13%), Immigrants from Romania (15.2%, a difference of 0.15%), Immigrants from Fiji (15.2%, a difference of 0.18%), and Immigrants from Scotland (15.2%, a difference of 0.29%).
| Demographics | Rating | Rank | Child Poverty Under the Age of 5 |
| Danes | 99.4 /100 | #55 | Exceptional 14.9% |
| Immigrants | Pakistan | 99.4 /100 | #56 | Exceptional 14.9% |
| Egyptians | 99.4 /100 | #57 | Exceptional 14.9% |
| Swedes | 99.4 /100 | #58 | Exceptional 15.0% |
| Paraguayans | 99.4 /100 | #59 | Exceptional 15.0% |
| Immigrants | Russia | 99.3 /100 | #60 | Exceptional 15.0% |
| Immigrants | Poland | 99.1 /100 | #61 | Exceptional 15.1% |
| Immigrants | Eastern Europe | 99.1 /100 | #62 | Exceptional 15.1% |
| Immigrants | Europe | 99.1 /100 | #63 | Exceptional 15.1% |
| Immigrants | Romania | 99.1 /100 | #64 | Exceptional 15.2% |
| Immigrants | Fiji | 99.0 /100 | #65 | Exceptional 15.2% |
| Immigrants | Scotland | 99.0 /100 | #66 | Exceptional 15.2% |
| Greeks | 99.0 /100 | #67 | Exceptional 15.2% |
| Zimbabweans | 99.0 /100 | #68 | Exceptional 15.2% |
| Lithuanians | 99.0 /100 | #69 | Exceptional 15.2% |