Central American vs Haitian Single Male Poverty
COMPARE
Central American
Haitian
Single Male Poverty
Single Male Poverty Comparison
Central Americans
Haitians
13.2%
SINGLE MALE POVERTY
10.9/ 100
METRIC RATING
220th/ 347
METRIC RANK
13.2%
SINGLE MALE POVERTY
7.0/ 100
METRIC RATING
227th/ 347
METRIC RANK
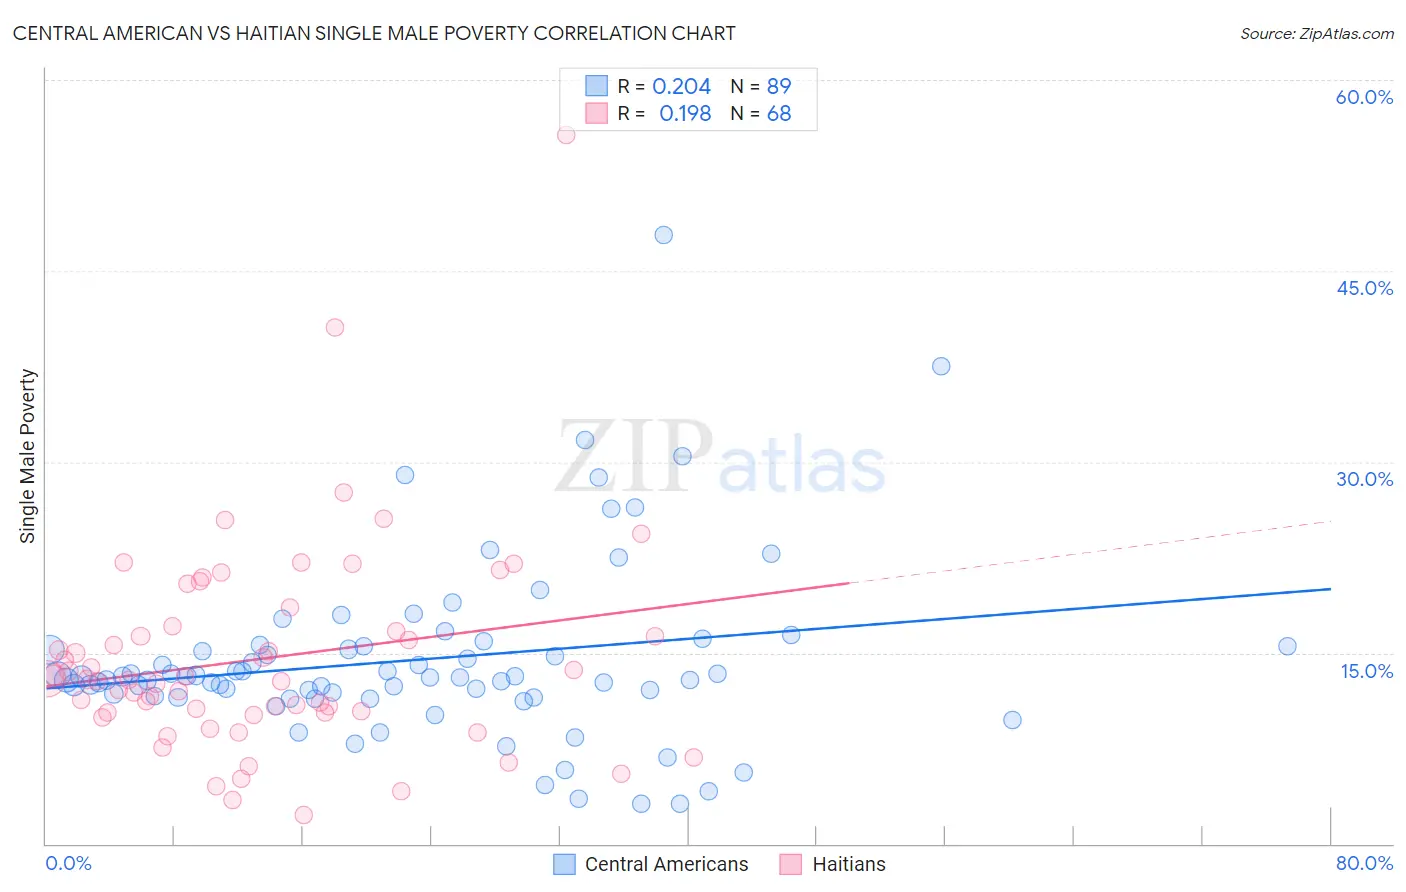
Central American vs Haitian Single Male Poverty Correlation Chart
The statistical analysis conducted on geographies consisting of 436,047,555 people shows a weak positive correlation between the proportion of Central Americans and poverty level among single males in the United States with a correlation coefficient (R) of 0.204 and weighted average of 13.2%. Similarly, the statistical analysis conducted on geographies consisting of 262,577,789 people shows a poor positive correlation between the proportion of Haitians and poverty level among single males in the United States with a correlation coefficient (R) of 0.198 and weighted average of 13.2%, a difference of 0.61%.
Single Male Poverty Correlation Summary
| Measurement | Central American | Haitian |
| Minimum | 3.1% | 2.3% |
| Maximum | 47.8% | 55.7% |
| Range | 44.7% | 53.4% |
| Mean | 14.5% | 14.5% |
| Median | 13.1% | 12.9% |
| Interquartile 25% (IQ1) | 11.5% | 10.3% |
| Interquartile 75% (IQ3) | 15.5% | 16.9% |
| Interquartile Range (IQR) | 4.0% | 6.6% |
| Standard Deviation (Sample) | 7.1% | 8.3% |
| Standard Deviation (Population) | 7.0% | 8.2% |
Demographics Similar to Central Americans and Haitians by Single Male Poverty
In terms of single male poverty, the demographic groups most similar to Central Americans are New Zealander (13.2%, a difference of 0.020%), Immigrants from Western Europe (13.2%, a difference of 0.11%), Immigrants from Burma/Myanmar (13.1%, a difference of 0.22%), Immigrants from the Azores (13.2%, a difference of 0.23%), and Scandinavian (13.1%, a difference of 0.25%). Similarly, the demographic groups most similar to Haitians are Lebanese (13.2%, a difference of 0.080%), Jamaican (13.2%, a difference of 0.13%), European (13.3%, a difference of 0.17%), Ghanaian (13.3%, a difference of 0.20%), and Immigrants from Denmark (13.2%, a difference of 0.30%).
| Demographics | Rating | Rank | Single Male Poverty |
| Italians | 15.9 /100 | #213 | Poor 13.1% |
| Zimbabweans | 14.9 /100 | #214 | Poor 13.1% |
| Japanese | 14.8 /100 | #215 | Poor 13.1% |
| Austrians | 13.9 /100 | #216 | Poor 13.1% |
| Bermudans | 13.0 /100 | #217 | Poor 13.1% |
| Scandinavians | 12.9 /100 | #218 | Poor 13.1% |
| Immigrants | Burma/Myanmar | 12.6 /100 | #219 | Poor 13.1% |
| Central Americans | 10.9 /100 | #220 | Poor 13.2% |
| New Zealanders | 10.7 /100 | #221 | Poor 13.2% |
| Immigrants | Western Europe | 10.0 /100 | #222 | Poor 13.2% |
| Immigrants | Azores | 9.3 /100 | #223 | Tragic 13.2% |
| Somalis | 9.1 /100 | #224 | Tragic 13.2% |
| Immigrants | Denmark | 8.7 /100 | #225 | Tragic 13.2% |
| Jamaicans | 7.7 /100 | #226 | Tragic 13.2% |
| Haitians | 7.0 /100 | #227 | Tragic 13.2% |
| Lebanese | 6.6 /100 | #228 | Tragic 13.2% |
| Europeans | 6.2 /100 | #229 | Tragic 13.3% |
| Ghanaians | 6.1 /100 | #230 | Tragic 13.3% |
| Slavs | 5.3 /100 | #231 | Tragic 13.3% |
| Immigrants | Caribbean | 5.0 /100 | #232 | Tragic 13.3% |
| British | 4.0 /100 | #233 | Tragic 13.3% |