Central American vs Immigrants from Russia Single Male Poverty
COMPARE
Central American
Immigrants from Russia
Single Male Poverty
Single Male Poverty Comparison
Central Americans
Immigrants from Russia
13.2%
SINGLE MALE POVERTY
10.9/ 100
METRIC RATING
220th/ 347
METRIC RANK
11.9%
SINGLE MALE POVERTY
99.6/ 100
METRIC RATING
69th/ 347
METRIC RANK
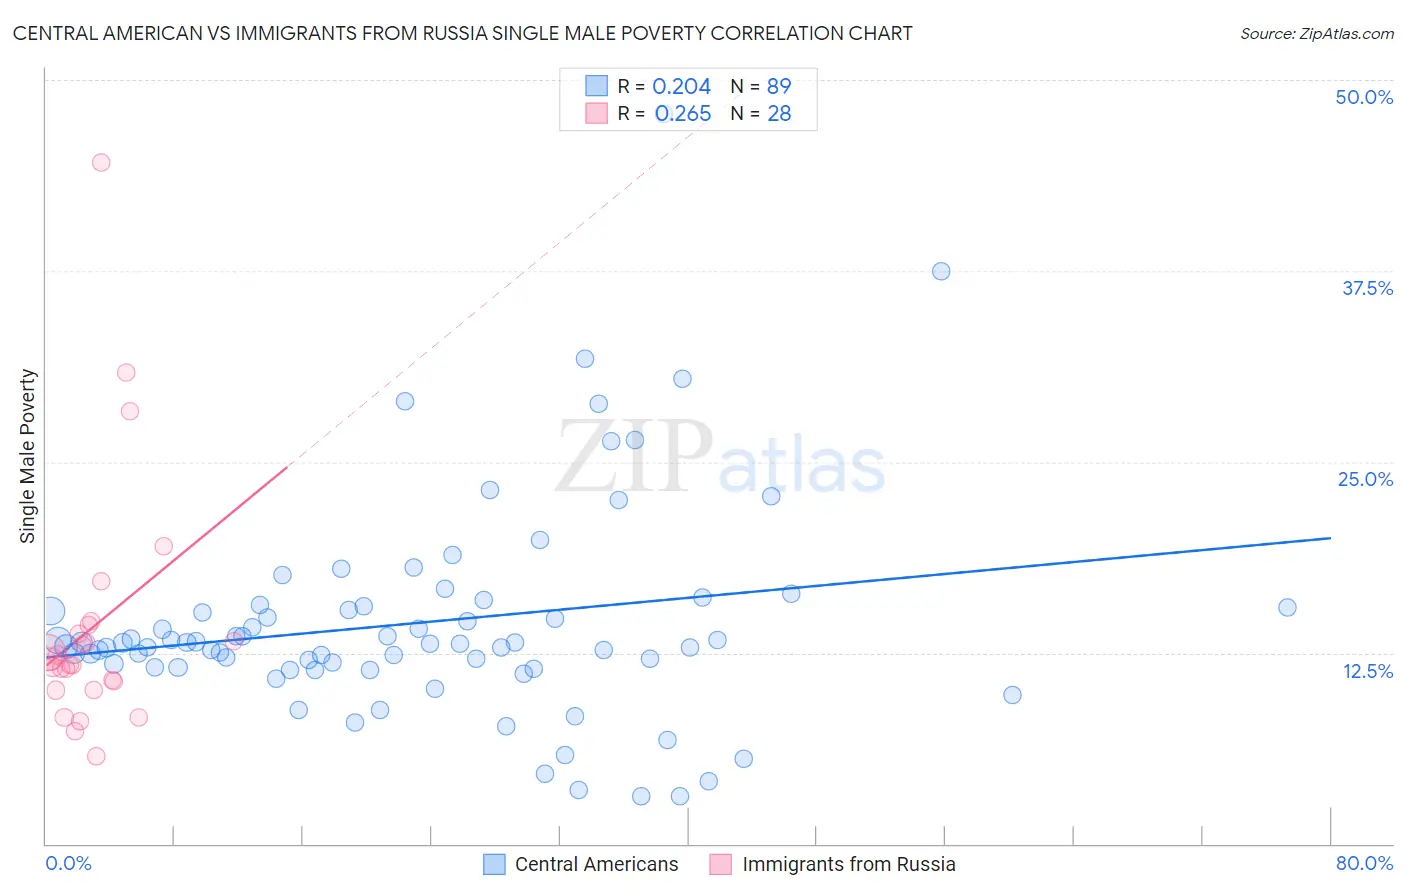
Central American vs Immigrants from Russia Single Male Poverty Correlation Chart
The statistical analysis conducted on geographies consisting of 436,047,555 people shows a weak positive correlation between the proportion of Central Americans and poverty level among single males in the United States with a correlation coefficient (R) of 0.204 and weighted average of 13.2%. Similarly, the statistical analysis conducted on geographies consisting of 307,851,464 people shows a weak positive correlation between the proportion of Immigrants from Russia and poverty level among single males in the United States with a correlation coefficient (R) of 0.265 and weighted average of 11.9%, a difference of 10.8%.
Single Male Poverty Correlation Summary
| Measurement | Central American | Immigrants from Russia |
| Minimum | 3.1% | 5.8% |
| Maximum | 47.8% | 44.6% |
| Range | 44.7% | 38.8% |
| Mean | 14.5% | 14.2% |
| Median | 13.1% | 11.9% |
| Interquartile 25% (IQ1) | 11.5% | 10.4% |
| Interquartile 75% (IQ3) | 15.5% | 14.0% |
| Interquartile Range (IQR) | 4.0% | 3.6% |
| Standard Deviation (Sample) | 7.1% | 8.1% |
| Standard Deviation (Population) | 7.0% | 7.9% |
Similar Demographics by Single Male Poverty
Demographics Similar to Central Americans by Single Male Poverty
In terms of single male poverty, the demographic groups most similar to Central Americans are New Zealander (13.2%, a difference of 0.020%), Immigrants from Western Europe (13.2%, a difference of 0.11%), Immigrants from Burma/Myanmar (13.1%, a difference of 0.22%), Immigrants from the Azores (13.2%, a difference of 0.23%), and Scandinavian (13.1%, a difference of 0.25%).
| Demographics | Rating | Rank | Single Male Poverty |
| Italians | 15.9 /100 | #213 | Poor 13.1% |
| Zimbabweans | 14.9 /100 | #214 | Poor 13.1% |
| Japanese | 14.8 /100 | #215 | Poor 13.1% |
| Austrians | 13.9 /100 | #216 | Poor 13.1% |
| Bermudans | 13.0 /100 | #217 | Poor 13.1% |
| Scandinavians | 12.9 /100 | #218 | Poor 13.1% |
| Immigrants | Burma/Myanmar | 12.6 /100 | #219 | Poor 13.1% |
| Central Americans | 10.9 /100 | #220 | Poor 13.2% |
| New Zealanders | 10.7 /100 | #221 | Poor 13.2% |
| Immigrants | Western Europe | 10.0 /100 | #222 | Poor 13.2% |
| Immigrants | Azores | 9.3 /100 | #223 | Tragic 13.2% |
| Somalis | 9.1 /100 | #224 | Tragic 13.2% |
| Immigrants | Denmark | 8.7 /100 | #225 | Tragic 13.2% |
| Jamaicans | 7.7 /100 | #226 | Tragic 13.2% |
| Haitians | 7.0 /100 | #227 | Tragic 13.2% |
Demographics Similar to Immigrants from Russia by Single Male Poverty
In terms of single male poverty, the demographic groups most similar to Immigrants from Russia are Immigrants from Croatia (11.9%, a difference of 0.020%), Immigrants from Nepal (11.9%, a difference of 0.020%), Immigrants from Ukraine (11.9%, a difference of 0.040%), Laotian (11.9%, a difference of 0.060%), and Immigrants from Uruguay (11.9%, a difference of 0.060%).
| Demographics | Rating | Rank | Single Male Poverty |
| Immigrants | Sri Lanka | 99.7 /100 | #62 | Exceptional 11.8% |
| Immigrants | Belarus | 99.7 /100 | #63 | Exceptional 11.8% |
| Immigrants | Eastern Europe | 99.6 /100 | #64 | Exceptional 11.8% |
| Laotians | 99.6 /100 | #65 | Exceptional 11.9% |
| Immigrants | Uruguay | 99.6 /100 | #66 | Exceptional 11.9% |
| Immigrants | Ukraine | 99.6 /100 | #67 | Exceptional 11.9% |
| Immigrants | Croatia | 99.6 /100 | #68 | Exceptional 11.9% |
| Immigrants | Russia | 99.6 /100 | #69 | Exceptional 11.9% |
| Immigrants | Nepal | 99.6 /100 | #70 | Exceptional 11.9% |
| Immigrants | Greece | 99.6 /100 | #71 | Exceptional 11.9% |
| Immigrants | Argentina | 99.5 /100 | #72 | Exceptional 11.9% |
| Argentineans | 99.5 /100 | #73 | Exceptional 11.9% |
| Chileans | 99.5 /100 | #74 | Exceptional 11.9% |
| Uruguayans | 99.4 /100 | #75 | Exceptional 11.9% |
| Immigrants | Northern Africa | 99.4 /100 | #76 | Exceptional 11.9% |