Central American Indian vs Immigrants from Croatia Single Mother Poverty
COMPARE
Central American Indian
Immigrants from Croatia
Single Mother Poverty
Single Mother Poverty Comparison
Central American Indians
Immigrants from Croatia
34.3%
SINGLE MOTHER POVERTY
0.0/ 100
METRIC RATING
312th/ 347
METRIC RANK
28.0%
SINGLE MOTHER POVERTY
96.7/ 100
METRIC RATING
102nd/ 347
METRIC RANK
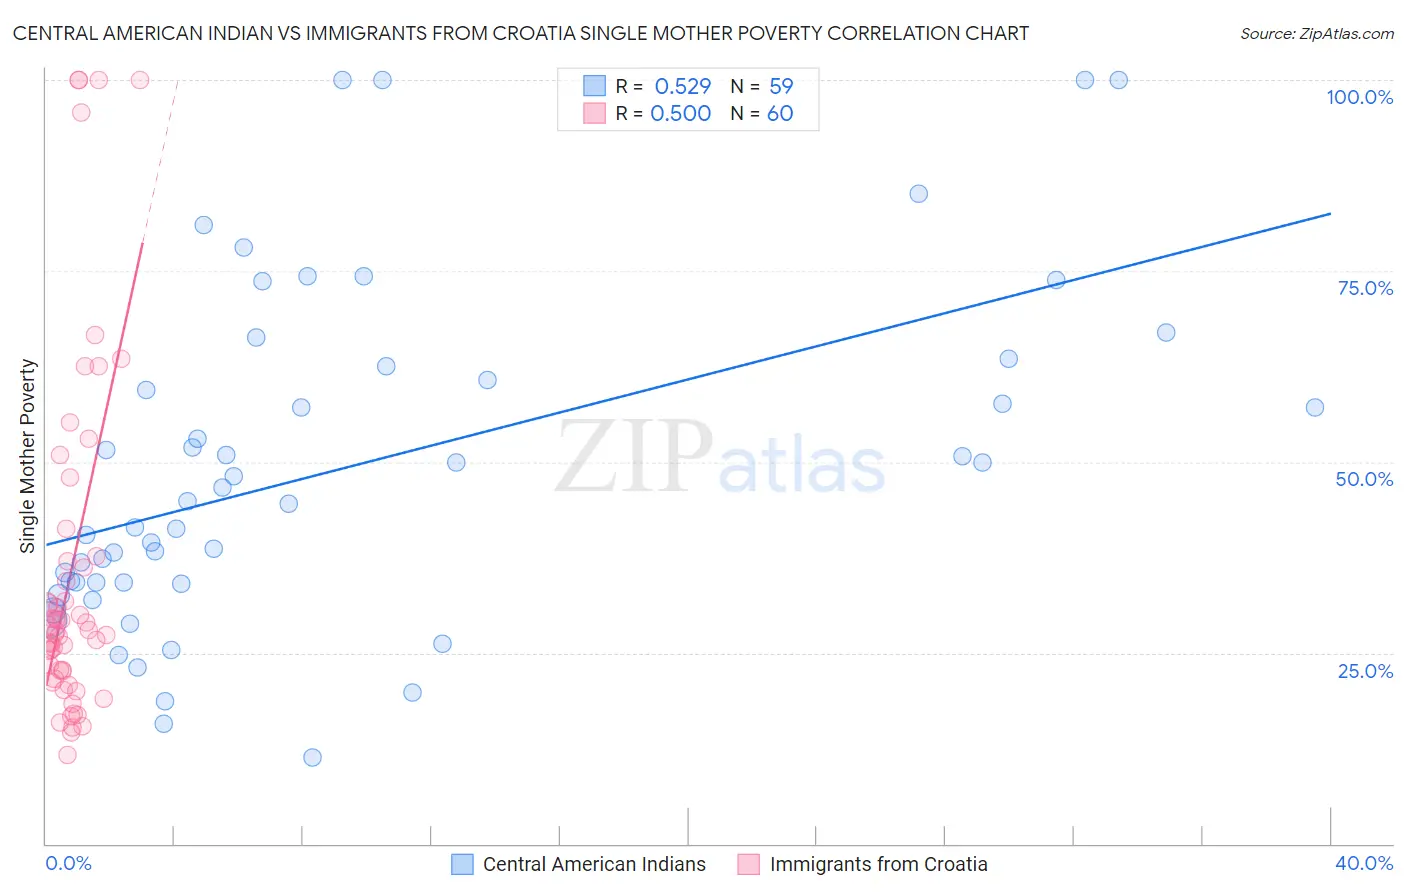
Central American Indian vs Immigrants from Croatia Single Mother Poverty Correlation Chart
The statistical analysis conducted on geographies consisting of 321,816,529 people shows a substantial positive correlation between the proportion of Central American Indians and poverty level among single mothers in the United States with a correlation coefficient (R) of 0.529 and weighted average of 34.3%. Similarly, the statistical analysis conducted on geographies consisting of 130,792,597 people shows a moderate positive correlation between the proportion of Immigrants from Croatia and poverty level among single mothers in the United States with a correlation coefficient (R) of 0.500 and weighted average of 28.0%, a difference of 22.7%.
Single Mother Poverty Correlation Summary
| Measurement | Central American Indian | Immigrants from Croatia |
| Minimum | 11.3% | 11.6% |
| Maximum | 100.0% | 100.0% |
| Range | 88.7% | 88.4% |
| Mean | 49.3% | 35.8% |
| Median | 44.9% | 27.9% |
| Interquartile 25% (IQ1) | 34.2% | 22.2% |
| Interquartile 75% (IQ3) | 62.6% | 37.3% |
| Interquartile Range (IQR) | 28.3% | 15.1% |
| Standard Deviation (Sample) | 22.0% | 23.1% |
| Standard Deviation (Population) | 21.8% | 22.9% |
Similar Demographics by Single Mother Poverty
Demographics Similar to Central American Indians by Single Mother Poverty
In terms of single mother poverty, the demographic groups most similar to Central American Indians are Alsatian (34.3%, a difference of 0.080%), Immigrants from Dominican Republic (34.4%, a difference of 0.080%), Chickasaw (34.4%, a difference of 0.26%), Hopi (34.5%, a difference of 0.34%), and Honduran (34.2%, a difference of 0.39%).
| Demographics | Rating | Rank | Single Mother Poverty |
| Immigrants | Central America | 0.0 /100 | #305 | Tragic 33.6% |
| Immigrants | Congo | 0.0 /100 | #306 | Tragic 33.8% |
| Comanche | 0.0 /100 | #307 | Tragic 33.9% |
| Immigrants | Mexico | 0.0 /100 | #308 | Tragic 34.0% |
| Potawatomi | 0.0 /100 | #309 | Tragic 34.1% |
| Hondurans | 0.0 /100 | #310 | Tragic 34.2% |
| Alsatians | 0.0 /100 | #311 | Tragic 34.3% |
| Central American Indians | 0.0 /100 | #312 | Tragic 34.3% |
| Immigrants | Dominican Republic | 0.0 /100 | #313 | Tragic 34.4% |
| Chickasaw | 0.0 /100 | #314 | Tragic 34.4% |
| Hopi | 0.0 /100 | #315 | Tragic 34.5% |
| Dominicans | 0.0 /100 | #316 | Tragic 34.5% |
| Cherokee | 0.0 /100 | #317 | Tragic 34.5% |
| Immigrants | Honduras | 0.0 /100 | #318 | Tragic 34.7% |
| Chippewa | 0.0 /100 | #319 | Tragic 34.8% |
Demographics Similar to Immigrants from Croatia by Single Mother Poverty
In terms of single mother poverty, the demographic groups most similar to Immigrants from Croatia are Immigrants from Northern Africa (28.0%, a difference of 0.020%), Italian (28.0%, a difference of 0.030%), Israeli (28.0%, a difference of 0.060%), Pakistani (28.0%, a difference of 0.10%), and Ukrainian (28.0%, a difference of 0.10%).
| Demographics | Rating | Rank | Single Mother Poverty |
| Chileans | 97.5 /100 | #95 | Exceptional 27.9% |
| Immigrants | Iraq | 97.3 /100 | #96 | Exceptional 27.9% |
| Immigrants | Brazil | 97.2 /100 | #97 | Exceptional 27.9% |
| Immigrants | Nepal | 97.2 /100 | #98 | Exceptional 27.9% |
| Immigrants | Netherlands | 97.2 /100 | #99 | Exceptional 27.9% |
| Zimbabweans | 97.1 /100 | #100 | Exceptional 27.9% |
| Pakistanis | 96.9 /100 | #101 | Exceptional 28.0% |
| Immigrants | Croatia | 96.7 /100 | #102 | Exceptional 28.0% |
| Immigrants | Northern Africa | 96.6 /100 | #103 | Exceptional 28.0% |
| Italians | 96.6 /100 | #104 | Exceptional 28.0% |
| Israelis | 96.5 /100 | #105 | Exceptional 28.0% |
| Ukrainians | 96.4 /100 | #106 | Exceptional 28.0% |
| Immigrants | Venezuela | 95.8 /100 | #107 | Exceptional 28.1% |
| Immigrants | Zimbabwe | 95.5 /100 | #108 | Exceptional 28.1% |
| Immigrants | Armenia | 95.2 /100 | #109 | Exceptional 28.1% |