Central American Indian vs Immigrants from Cabo Verde Female Poverty Among 25-34 Year Olds
COMPARE
Central American Indian
Immigrants from Cabo Verde
Female Poverty Among 25-34 Year Olds
Female Poverty Among 25-34 Year Olds Comparison
Central American Indians
Immigrants from Cabo Verde
18.2%
FEMALE POVERTY AMONG 25-34 YEAR OLDS
0.0/ 100
METRIC RATING
322nd/ 347
METRIC RANK
16.9%
FEMALE POVERTY AMONG 25-34 YEAR OLDS
0.0/ 100
METRIC RATING
305th/ 347
METRIC RANK
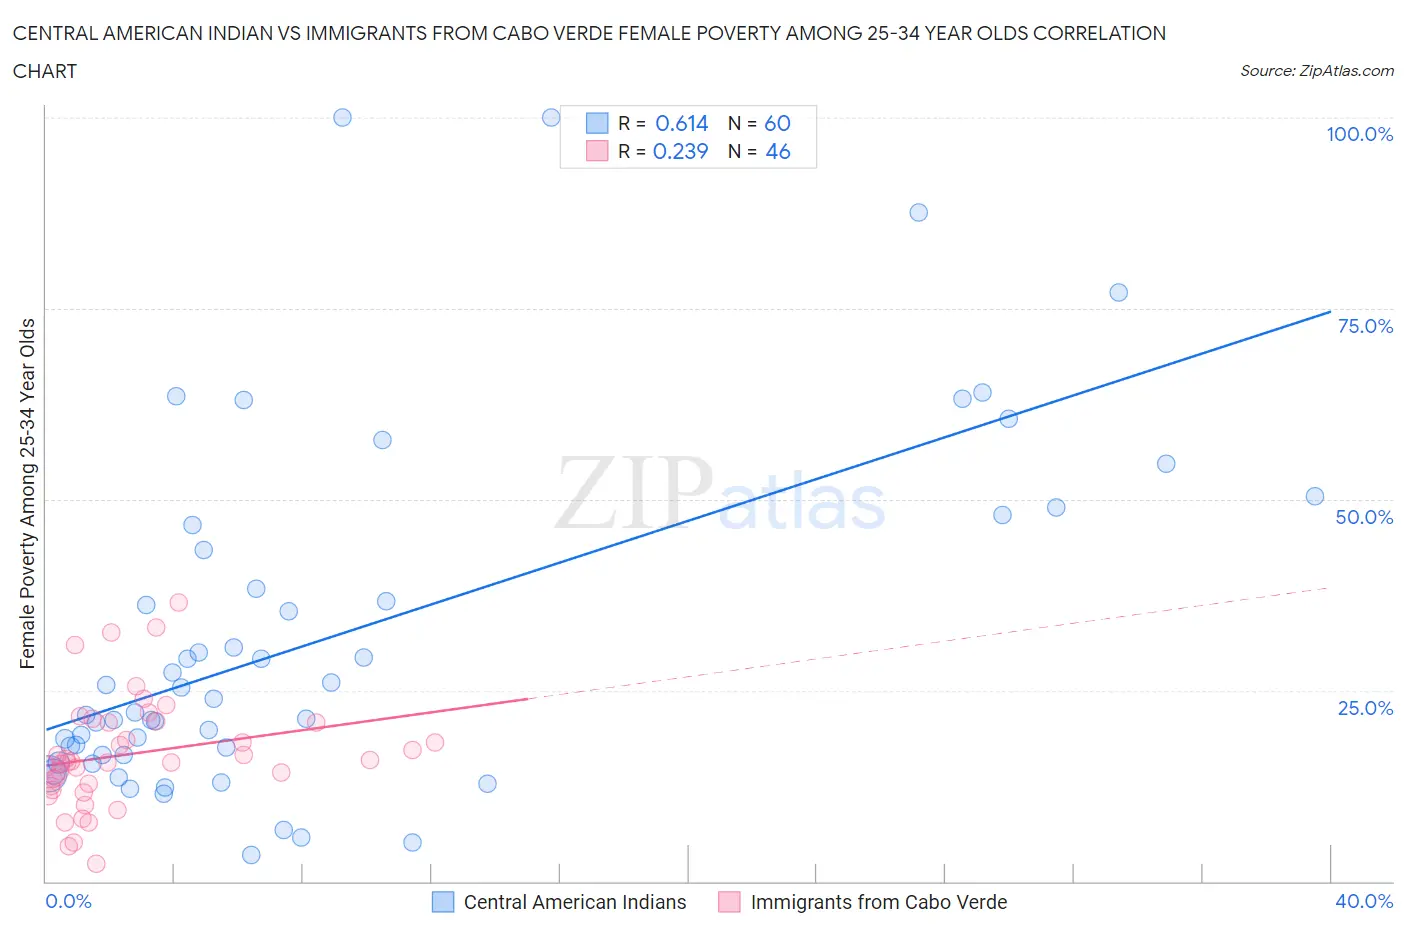
Central American Indian vs Immigrants from Cabo Verde Female Poverty Among 25-34 Year Olds Correlation Chart
The statistical analysis conducted on geographies consisting of 323,546,526 people shows a significant positive correlation between the proportion of Central American Indians and poverty level among females between the ages 25 and 34 in the United States with a correlation coefficient (R) of 0.614 and weighted average of 18.2%. Similarly, the statistical analysis conducted on geographies consisting of 37,988,788 people shows a weak positive correlation between the proportion of Immigrants from Cabo Verde and poverty level among females between the ages 25 and 34 in the United States with a correlation coefficient (R) of 0.239 and weighted average of 16.9%, a difference of 7.6%.
Female Poverty Among 25-34 Year Olds Correlation Summary
| Measurement | Central American Indian | Immigrants from Cabo Verde |
| Minimum | 3.4% | 2.3% |
| Maximum | 100.0% | 36.4% |
| Range | 96.6% | 34.2% |
| Mean | 32.0% | 16.7% |
| Median | 23.0% | 15.6% |
| Interquartile 25% (IQ1) | 16.6% | 12.5% |
| Interquartile 75% (IQ3) | 45.0% | 20.8% |
| Interquartile Range (IQR) | 28.4% | 8.3% |
| Standard Deviation (Sample) | 22.8% | 7.3% |
| Standard Deviation (Population) | 22.6% | 7.2% |
Demographics Similar to Central American Indians and Immigrants from Cabo Verde by Female Poverty Among 25-34 Year Olds
In terms of female poverty among 25-34 year olds, the demographic groups most similar to Central American Indians are Seminole (18.3%, a difference of 0.32%), Choctaw (18.1%, a difference of 0.84%), Chippewa (18.0%, a difference of 1.1%), Menominee (18.0%, a difference of 1.3%), and Ute (17.9%, a difference of 1.9%). Similarly, the demographic groups most similar to Immigrants from Cabo Verde are Honduran (16.9%, a difference of 0.17%), Immigrants from Mexico (16.8%, a difference of 0.58%), Chickasaw (17.0%, a difference of 0.58%), Yaqui (17.0%, a difference of 0.60%), and African (17.0%, a difference of 0.80%).
| Demographics | Rating | Rank | Female Poverty Among 25-34 Year Olds |
| Immigrants | Mexico | 0.0 /100 | #303 | Tragic 16.8% |
| Hondurans | 0.0 /100 | #304 | Tragic 16.9% |
| Immigrants | Cabo Verde | 0.0 /100 | #305 | Tragic 16.9% |
| Chickasaw | 0.0 /100 | #306 | Tragic 17.0% |
| Yaqui | 0.0 /100 | #307 | Tragic 17.0% |
| Africans | 0.0 /100 | #308 | Tragic 17.0% |
| Ottawa | 0.0 /100 | #309 | Tragic 17.1% |
| Cherokee | 0.0 /100 | #310 | Tragic 17.2% |
| Immigrants | Honduras | 0.0 /100 | #311 | Tragic 17.3% |
| Iroquois | 0.0 /100 | #312 | Tragic 17.5% |
| Colville | 0.0 /100 | #313 | Tragic 17.5% |
| Immigrants | Dominican Republic | 0.0 /100 | #314 | Tragic 17.6% |
| Yakama | 0.0 /100 | #315 | Tragic 17.6% |
| Dominicans | 0.0 /100 | #316 | Tragic 17.6% |
| Arapaho | 0.0 /100 | #317 | Tragic 17.8% |
| Ute | 0.0 /100 | #318 | Tragic 17.9% |
| Menominee | 0.0 /100 | #319 | Tragic 18.0% |
| Chippewa | 0.0 /100 | #320 | Tragic 18.0% |
| Choctaw | 0.0 /100 | #321 | Tragic 18.1% |
| Central American Indians | 0.0 /100 | #322 | Tragic 18.2% |
| Seminole | 0.0 /100 | #323 | Tragic 18.3% |