Central American Indian vs Latvian Female Poverty
COMPARE
Central American Indian
Latvian
Female Poverty
Female Poverty Comparison
Central American Indians
Latvians
18.0%
FEMALE POVERTY
0.0/ 100
METRIC RATING
326th/ 347
METRIC RANK
11.4%
FEMALE POVERTY
99.8/ 100
METRIC RATING
15th/ 347
METRIC RANK
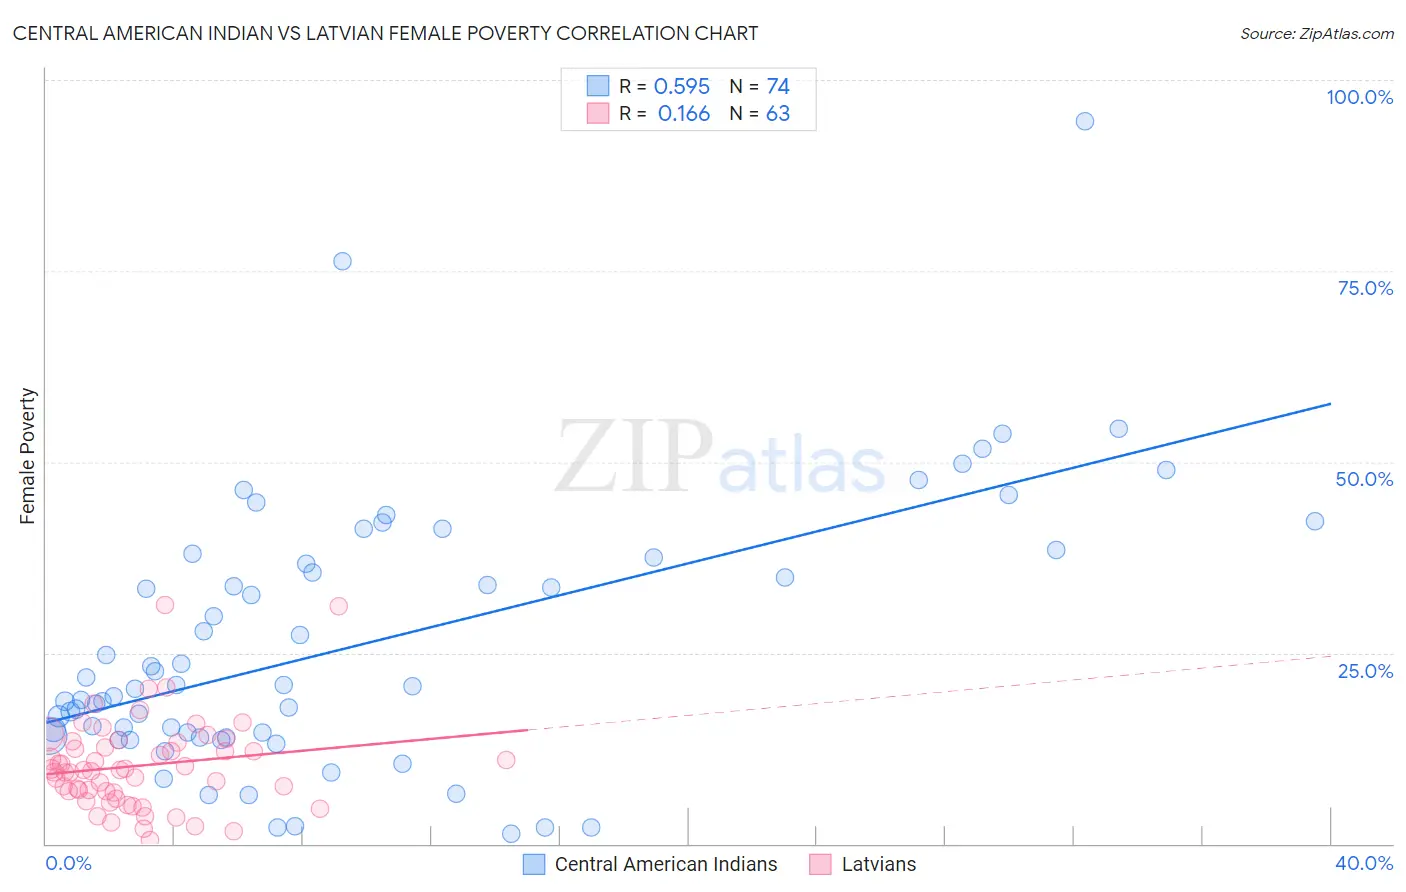
Central American Indian vs Latvian Female Poverty Correlation Chart
The statistical analysis conducted on geographies consisting of 326,040,737 people shows a substantial positive correlation between the proportion of Central American Indians and poverty level among females in the United States with a correlation coefficient (R) of 0.595 and weighted average of 18.0%. Similarly, the statistical analysis conducted on geographies consisting of 220,618,449 people shows a poor positive correlation between the proportion of Latvians and poverty level among females in the United States with a correlation coefficient (R) of 0.166 and weighted average of 11.4%, a difference of 57.7%.
Female Poverty Correlation Summary
| Measurement | Central American Indian | Latvian |
| Minimum | 1.4% | 0.50% |
| Maximum | 94.5% | 31.3% |
| Range | 93.2% | 30.8% |
| Mean | 26.1% | 10.2% |
| Median | 20.8% | 9.6% |
| Interquartile 25% (IQ1) | 14.1% | 6.7% |
| Interquartile 75% (IQ3) | 37.5% | 13.3% |
| Interquartile Range (IQR) | 23.4% | 6.5% |
| Standard Deviation (Sample) | 17.4% | 5.9% |
| Standard Deviation (Population) | 17.3% | 5.9% |
Similar Demographics by Female Poverty
Demographics Similar to Central American Indians by Female Poverty
In terms of female poverty, the demographic groups most similar to Central American Indians are Yakama (18.0%, a difference of 0.10%), Colville (17.8%, a difference of 1.5%), Immigrants from Honduras (17.7%, a difference of 1.7%), Paiute (17.7%, a difference of 1.9%), and Menominee (17.6%, a difference of 2.5%).
| Demographics | Rating | Rank | Female Poverty |
| Cajuns | 0.0 /100 | #319 | Tragic 17.5% |
| Immigrants | Dominica | 0.0 /100 | #320 | Tragic 17.5% |
| Arapaho | 0.0 /100 | #321 | Tragic 17.5% |
| Menominee | 0.0 /100 | #322 | Tragic 17.6% |
| Paiute | 0.0 /100 | #323 | Tragic 17.7% |
| Immigrants | Honduras | 0.0 /100 | #324 | Tragic 17.7% |
| Colville | 0.0 /100 | #325 | Tragic 17.8% |
| Central American Indians | 0.0 /100 | #326 | Tragic 18.0% |
| Yakama | 0.0 /100 | #327 | Tragic 18.0% |
| Blacks/African Americans | 0.0 /100 | #328 | Tragic 18.6% |
| Kiowa | 0.0 /100 | #329 | Tragic 18.6% |
| Dominicans | 0.0 /100 | #330 | Tragic 19.1% |
| Natives/Alaskans | 0.0 /100 | #331 | Tragic 19.2% |
| Apache | 0.0 /100 | #332 | Tragic 19.2% |
| Immigrants | Dominican Republic | 0.0 /100 | #333 | Tragic 19.3% |
Demographics Similar to Latvians by Female Poverty
In terms of female poverty, the demographic groups most similar to Latvians are Lithuanian (11.4%, a difference of 0.32%), Immigrants from Bolivia (11.5%, a difference of 0.47%), Bolivian (11.5%, a difference of 0.54%), Immigrants from Scotland (11.5%, a difference of 0.59%), and Norwegian (11.5%, a difference of 0.64%).
| Demographics | Rating | Rank | Female Poverty |
| Immigrants | South Central Asia | 99.9 /100 | #8 | Exceptional 11.1% |
| Bulgarians | 99.9 /100 | #9 | Exceptional 11.1% |
| Immigrants | Hong Kong | 99.9 /100 | #10 | Exceptional 11.2% |
| Maltese | 99.9 /100 | #11 | Exceptional 11.2% |
| Bhutanese | 99.9 /100 | #12 | Exceptional 11.3% |
| Immigrants | Lithuania | 99.9 /100 | #13 | Exceptional 11.3% |
| Lithuanians | 99.8 /100 | #14 | Exceptional 11.4% |
| Latvians | 99.8 /100 | #15 | Exceptional 11.4% |
| Immigrants | Bolivia | 99.8 /100 | #16 | Exceptional 11.5% |
| Bolivians | 99.8 /100 | #17 | Exceptional 11.5% |
| Immigrants | Scotland | 99.8 /100 | #18 | Exceptional 11.5% |
| Norwegians | 99.8 /100 | #19 | Exceptional 11.5% |
| Eastern Europeans | 99.7 /100 | #20 | Exceptional 11.5% |
| Italians | 99.7 /100 | #21 | Exceptional 11.6% |
| Swedes | 99.7 /100 | #22 | Exceptional 11.6% |