Shoshone vs Nonimmigrants Female Poverty Among 25-34 Year Olds
COMPARE
Shoshone
Nonimmigrants
Female Poverty Among 25-34 Year Olds
Female Poverty Among 25-34 Year Olds Comparison
Shoshone
Nonimmigrants
16.2%
FEMALE POVERTY AMONG 25-34 YEAR OLDS
0.0/ 100
METRIC RATING
284th/ 347
METRIC RANK
15.6%
FEMALE POVERTY AMONG 25-34 YEAR OLDS
0.1/ 100
METRIC RATING
273rd/ 347
METRIC RANK
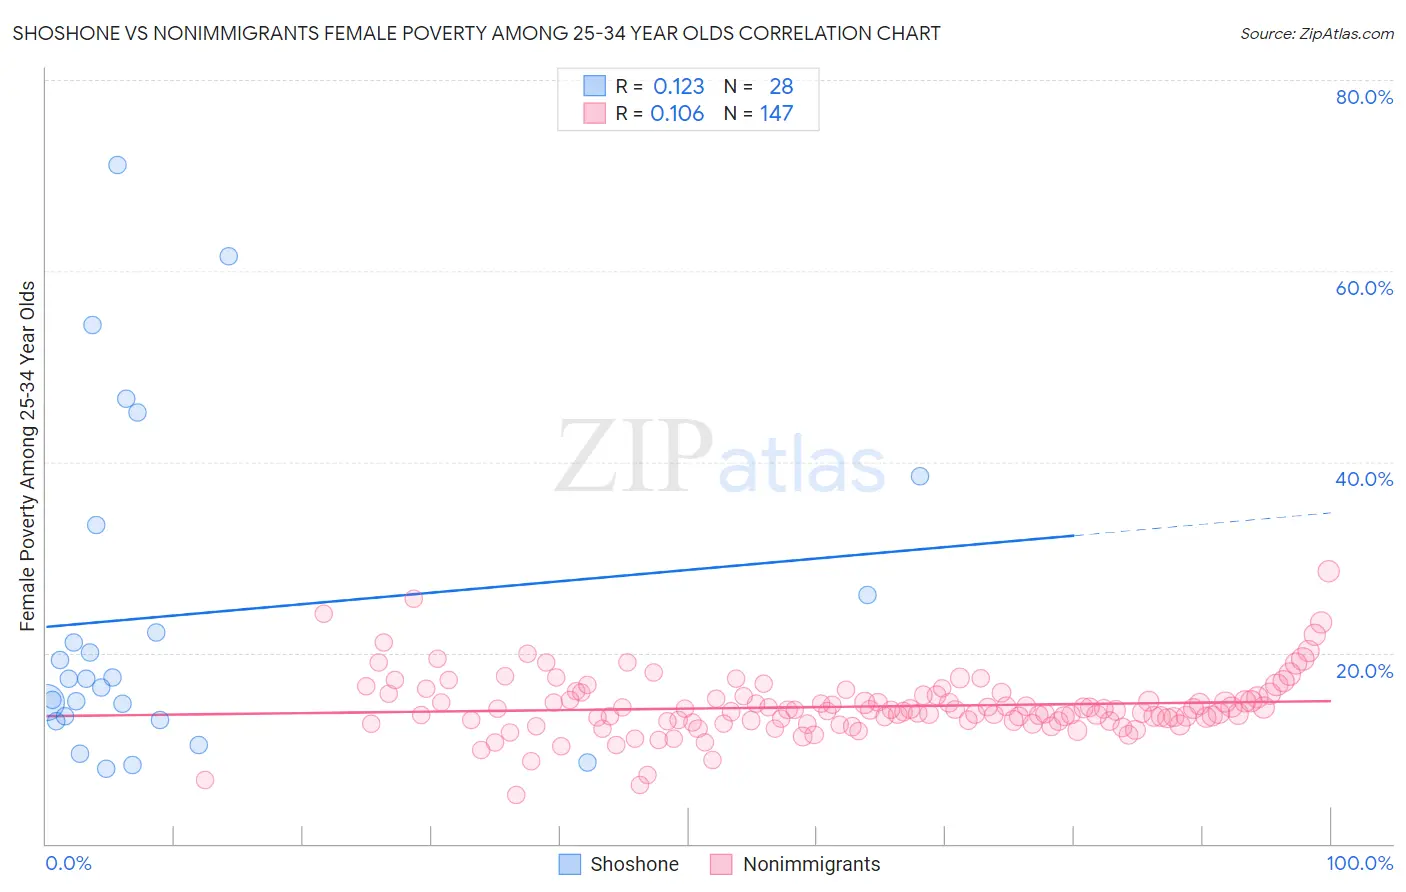
Shoshone vs Nonimmigrants Female Poverty Among 25-34 Year Olds Correlation Chart
The statistical analysis conducted on geographies consisting of 66,384,090 people shows a poor positive correlation between the proportion of Shoshone and poverty level among females between the ages 25 and 34 in the United States with a correlation coefficient (R) of 0.123 and weighted average of 16.2%. Similarly, the statistical analysis conducted on geographies consisting of 559,225,521 people shows a poor positive correlation between the proportion of Nonimmigrants and poverty level among females between the ages 25 and 34 in the United States with a correlation coefficient (R) of 0.106 and weighted average of 15.6%, a difference of 3.8%.
Female Poverty Among 25-34 Year Olds Correlation Summary
| Measurement | Shoshone | Nonimmigrants |
| Minimum | 7.9% | 5.1% |
| Maximum | 71.1% | 28.6% |
| Range | 63.3% | 23.5% |
| Mean | 24.0% | 14.4% |
| Median | 17.3% | 14.0% |
| Interquartile 25% (IQ1) | 13.1% | 12.9% |
| Interquartile 75% (IQ3) | 29.7% | 15.5% |
| Interquartile Range (IQR) | 16.6% | 2.7% |
| Standard Deviation (Sample) | 17.1% | 3.2% |
| Standard Deviation (Population) | 16.8% | 3.2% |
Demographics Similar to Shoshone and Nonimmigrants by Female Poverty Among 25-34 Year Olds
In terms of female poverty among 25-34 year olds, the demographic groups most similar to Shoshone are Immigrants from Bahamas (16.3%, a difference of 0.50%), Cape Verdean (16.3%, a difference of 0.68%), American (16.4%, a difference of 0.73%), Bahamian (16.1%, a difference of 0.83%), and Aleut (16.1%, a difference of 0.87%). Similarly, the demographic groups most similar to Nonimmigrants are Senegalese (15.6%, a difference of 0.11%), Cree (15.6%, a difference of 0.17%), British West Indian (15.6%, a difference of 0.18%), Subsaharan African (15.6%, a difference of 0.33%), and Immigrants from Caribbean (15.7%, a difference of 0.49%).
| Demographics | Rating | Rank | Female Poverty Among 25-34 Year Olds |
| Immigrants | Senegal | 0.1 /100 | #268 | Tragic 15.6% |
| Sub-Saharan Africans | 0.1 /100 | #269 | Tragic 15.6% |
| British West Indians | 0.1 /100 | #270 | Tragic 15.6% |
| Cree | 0.1 /100 | #271 | Tragic 15.6% |
| Senegalese | 0.1 /100 | #272 | Tragic 15.6% |
| Immigrants | Nonimmigrants | 0.1 /100 | #273 | Tragic 15.6% |
| Immigrants | Caribbean | 0.0 /100 | #274 | Tragic 15.7% |
| Immigrants | Azores | 0.0 /100 | #275 | Tragic 15.8% |
| Immigrants | Zaire | 0.0 /100 | #276 | Tragic 15.8% |
| Immigrants | Micronesia | 0.0 /100 | #277 | Tragic 15.8% |
| French American Indians | 0.0 /100 | #278 | Tragic 15.9% |
| Fijians | 0.0 /100 | #279 | Tragic 15.9% |
| Bangladeshis | 0.0 /100 | #280 | Tragic 15.9% |
| Immigrants | Latin America | 0.0 /100 | #281 | Tragic 16.0% |
| Aleuts | 0.0 /100 | #282 | Tragic 16.1% |
| Bahamians | 0.0 /100 | #283 | Tragic 16.1% |
| Shoshone | 0.0 /100 | #284 | Tragic 16.2% |
| Immigrants | Bahamas | 0.0 /100 | #285 | Tragic 16.3% |
| Cape Verdeans | 0.0 /100 | #286 | Tragic 16.3% |
| Americans | 0.0 /100 | #287 | Tragic 16.4% |
| Guatemalans | 0.0 /100 | #288 | Tragic 16.4% |