Belizean vs Nonimmigrants Female Poverty Among 25-34 Year Olds
COMPARE
Belizean
Nonimmigrants
Female Poverty Among 25-34 Year Olds
Female Poverty Among 25-34 Year Olds Comparison
Belizeans
Nonimmigrants
15.1%
FEMALE POVERTY AMONG 25-34 YEAR OLDS
0.4/ 100
METRIC RATING
252nd/ 347
METRIC RANK
15.6%
FEMALE POVERTY AMONG 25-34 YEAR OLDS
0.1/ 100
METRIC RATING
273rd/ 347
METRIC RANK
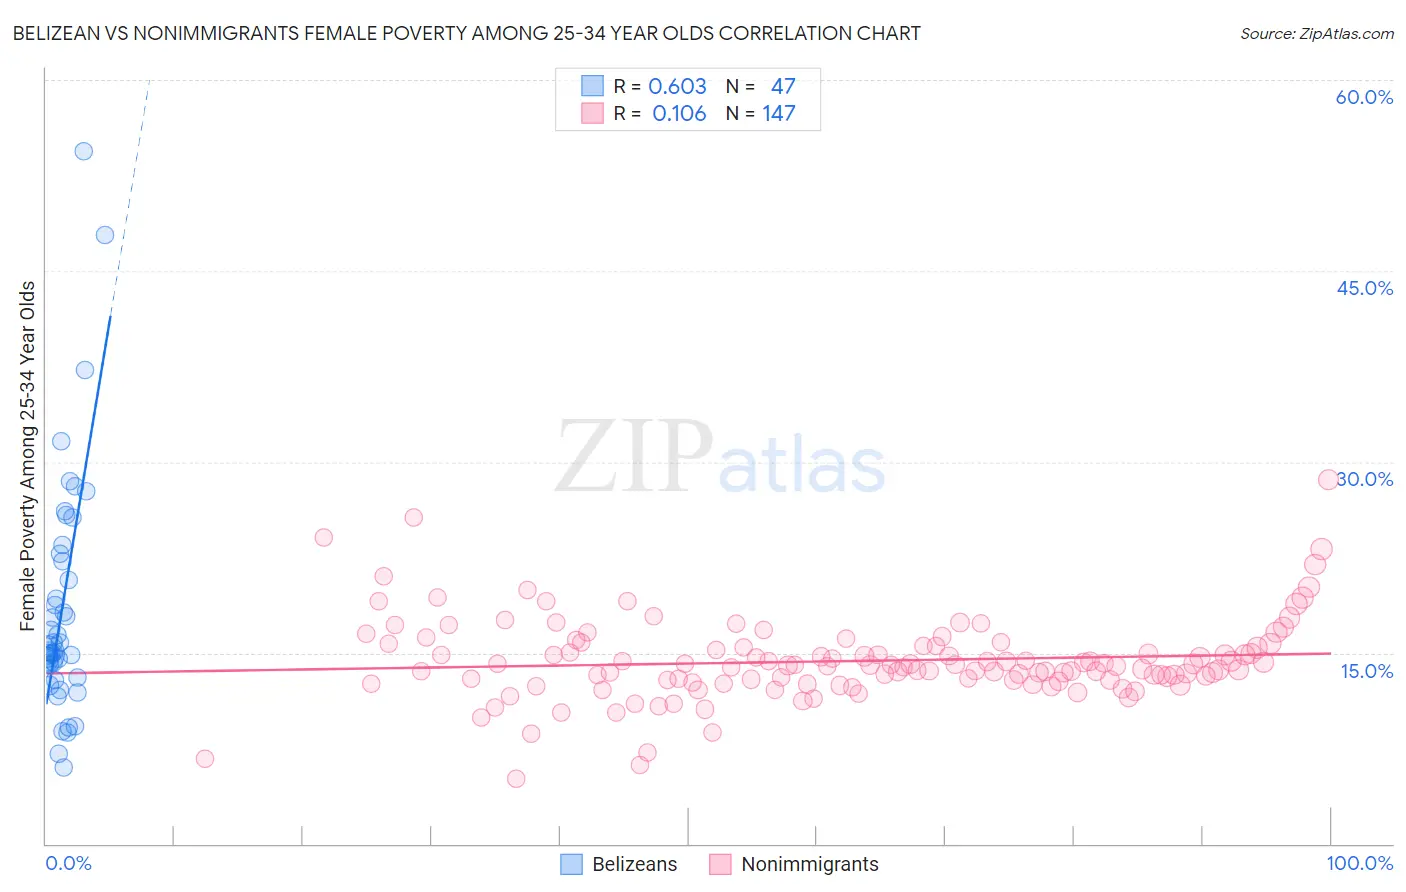
Belizean vs Nonimmigrants Female Poverty Among 25-34 Year Olds Correlation Chart
The statistical analysis conducted on geographies consisting of 143,799,861 people shows a significant positive correlation between the proportion of Belizeans and poverty level among females between the ages 25 and 34 in the United States with a correlation coefficient (R) of 0.603 and weighted average of 15.1%. Similarly, the statistical analysis conducted on geographies consisting of 559,225,521 people shows a poor positive correlation between the proportion of Nonimmigrants and poverty level among females between the ages 25 and 34 in the United States with a correlation coefficient (R) of 0.106 and weighted average of 15.6%, a difference of 3.8%.
Female Poverty Among 25-34 Year Olds Correlation Summary
| Measurement | Belizean | Nonimmigrants |
| Minimum | 6.0% | 5.1% |
| Maximum | 54.4% | 28.6% |
| Range | 48.4% | 23.5% |
| Mean | 18.7% | 14.4% |
| Median | 15.1% | 14.0% |
| Interquartile 25% (IQ1) | 13.0% | 12.9% |
| Interquartile 75% (IQ3) | 22.8% | 15.5% |
| Interquartile Range (IQR) | 9.8% | 2.7% |
| Standard Deviation (Sample) | 9.6% | 3.2% |
| Standard Deviation (Population) | 9.5% | 3.2% |
Similar Demographics by Female Poverty Among 25-34 Year Olds
Demographics Similar to Belizeans by Female Poverty Among 25-34 Year Olds
In terms of female poverty among 25-34 year olds, the demographic groups most similar to Belizeans are Immigrants from West Indies (15.1%, a difference of 0.14%), Haitian (15.0%, a difference of 0.17%), Somali (15.1%, a difference of 0.22%), Immigrants from El Salvador (15.0%, a difference of 0.36%), and Immigrants from Haiti (15.0%, a difference of 0.39%).
| Demographics | Rating | Rank | Female Poverty Among 25-34 Year Olds |
| Immigrants | Middle Africa | 1.0 /100 | #245 | Tragic 14.8% |
| Jamaicans | 1.0 /100 | #246 | Tragic 14.8% |
| German Russians | 0.8 /100 | #247 | Tragic 14.9% |
| Immigrants | Western Africa | 0.8 /100 | #248 | Tragic 14.9% |
| Immigrants | Haiti | 0.5 /100 | #249 | Tragic 15.0% |
| Immigrants | El Salvador | 0.5 /100 | #250 | Tragic 15.0% |
| Haitians | 0.5 /100 | #251 | Tragic 15.0% |
| Belizeans | 0.4 /100 | #252 | Tragic 15.1% |
| Immigrants | West Indies | 0.4 /100 | #253 | Tragic 15.1% |
| Somalis | 0.4 /100 | #254 | Tragic 15.1% |
| Immigrants | Laos | 0.3 /100 | #255 | Tragic 15.2% |
| West Indians | 0.3 /100 | #256 | Tragic 15.2% |
| Immigrants | Burma/Myanmar | 0.3 /100 | #257 | Tragic 15.2% |
| Nepalese | 0.2 /100 | #258 | Tragic 15.2% |
| Immigrants | Cuba | 0.2 /100 | #259 | Tragic 15.2% |
Demographics Similar to Nonimmigrants by Female Poverty Among 25-34 Year Olds
In terms of female poverty among 25-34 year olds, the demographic groups most similar to Nonimmigrants are Senegalese (15.6%, a difference of 0.11%), Cree (15.6%, a difference of 0.17%), British West Indian (15.6%, a difference of 0.18%), Subsaharan African (15.6%, a difference of 0.33%), and Immigrants from Caribbean (15.7%, a difference of 0.49%).
| Demographics | Rating | Rank | Female Poverty Among 25-34 Year Olds |
| Immigrants | Somalia | 0.1 /100 | #266 | Tragic 15.4% |
| Central Americans | 0.1 /100 | #267 | Tragic 15.5% |
| Immigrants | Senegal | 0.1 /100 | #268 | Tragic 15.6% |
| Sub-Saharan Africans | 0.1 /100 | #269 | Tragic 15.6% |
| British West Indians | 0.1 /100 | #270 | Tragic 15.6% |
| Cree | 0.1 /100 | #271 | Tragic 15.6% |
| Senegalese | 0.1 /100 | #272 | Tragic 15.6% |
| Immigrants | Nonimmigrants | 0.1 /100 | #273 | Tragic 15.6% |
| Immigrants | Caribbean | 0.0 /100 | #274 | Tragic 15.7% |
| Immigrants | Azores | 0.0 /100 | #275 | Tragic 15.8% |
| Immigrants | Zaire | 0.0 /100 | #276 | Tragic 15.8% |
| Immigrants | Micronesia | 0.0 /100 | #277 | Tragic 15.8% |
| French American Indians | 0.0 /100 | #278 | Tragic 15.9% |
| Fijians | 0.0 /100 | #279 | Tragic 15.9% |
| Bangladeshis | 0.0 /100 | #280 | Tragic 15.9% |