Cape Verdean vs Ukrainian Family Poverty
COMPARE
Cape Verdean
Ukrainian
Family Poverty
Family Poverty Comparison
Cape Verdeans
Ukrainians
10.9%
FAMILY POVERTY
0.1/ 100
METRIC RATING
263rd/ 347
METRIC RANK
7.9%
FAMILY POVERTY
98.0/ 100
METRIC RATING
77th/ 347
METRIC RANK
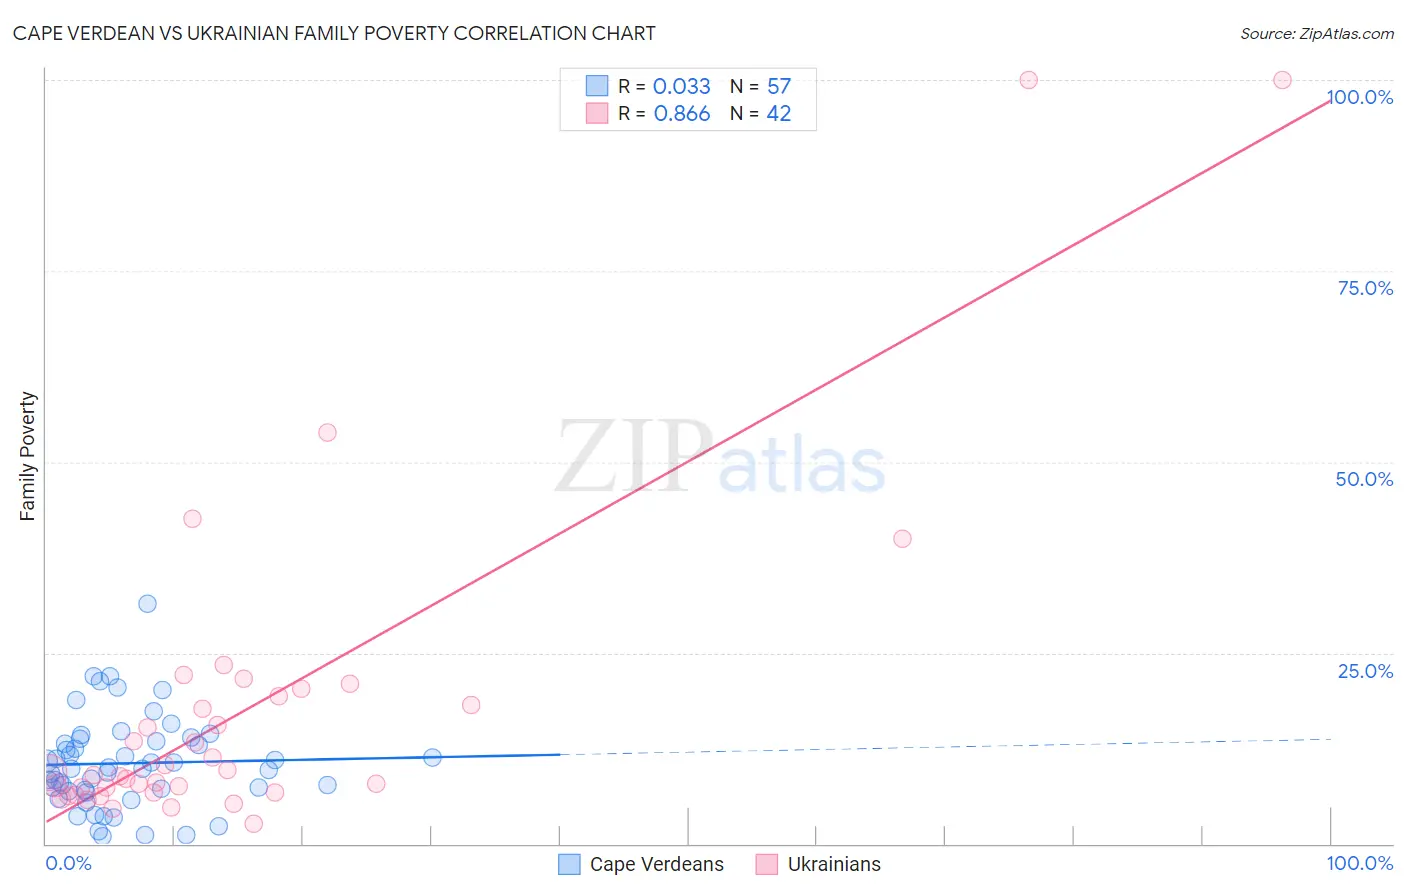
Cape Verdean vs Ukrainian Family Poverty Correlation Chart
The statistical analysis conducted on geographies consisting of 107,439,266 people shows no correlation between the proportion of Cape Verdeans and poverty level among families in the United States with a correlation coefficient (R) of 0.033 and weighted average of 10.9%. Similarly, the statistical analysis conducted on geographies consisting of 446,514,525 people shows a very strong positive correlation between the proportion of Ukrainians and poverty level among families in the United States with a correlation coefficient (R) of 0.866 and weighted average of 7.9%, a difference of 39.1%.
Family Poverty Correlation Summary
| Measurement | Cape Verdean | Ukrainian |
| Minimum | 0.95% | 2.6% |
| Maximum | 31.5% | 100.0% |
| Range | 30.5% | 97.4% |
| Mean | 10.5% | 17.6% |
| Median | 9.9% | 9.2% |
| Interquartile 25% (IQ1) | 7.0% | 6.8% |
| Interquartile 75% (IQ3) | 13.6% | 19.3% |
| Interquartile Range (IQR) | 6.6% | 12.5% |
| Standard Deviation (Sample) | 6.0% | 21.5% |
| Standard Deviation (Population) | 6.0% | 21.2% |
Similar Demographics by Family Poverty
Demographics Similar to Cape Verdeans by Family Poverty
In terms of family poverty, the demographic groups most similar to Cape Verdeans are Trinidadian and Tobagonian (10.9%, a difference of 0.020%), Immigrants from Trinidad and Tobago (10.9%, a difference of 0.070%), Spanish American Indian (10.9%, a difference of 0.26%), Shoshone (10.9%, a difference of 0.39%), and Bangladeshi (10.9%, a difference of 0.43%).
| Demographics | Rating | Rank | Family Poverty |
| Chickasaw | 0.2 /100 | #256 | Tragic 10.8% |
| Immigrants | Ghana | 0.2 /100 | #257 | Tragic 10.8% |
| Sub-Saharan Africans | 0.2 /100 | #258 | Tragic 10.9% |
| Mexican American Indians | 0.2 /100 | #259 | Tragic 10.9% |
| Bangladeshis | 0.2 /100 | #260 | Tragic 10.9% |
| Shoshone | 0.2 /100 | #261 | Tragic 10.9% |
| Spanish American Indians | 0.2 /100 | #262 | Tragic 10.9% |
| Cape Verdeans | 0.1 /100 | #263 | Tragic 10.9% |
| Trinidadians and Tobagonians | 0.1 /100 | #264 | Tragic 10.9% |
| Immigrants | Trinidad and Tobago | 0.1 /100 | #265 | Tragic 10.9% |
| Immigrants | El Salvador | 0.1 /100 | #266 | Tragic 11.0% |
| Comanche | 0.1 /100 | #267 | Tragic 11.0% |
| Jamaicans | 0.1 /100 | #268 | Tragic 11.1% |
| Immigrants | Ecuador | 0.1 /100 | #269 | Tragic 11.1% |
| Immigrants | Nicaragua | 0.1 /100 | #270 | Tragic 11.1% |
Demographics Similar to Ukrainians by Family Poverty
In terms of family poverty, the demographic groups most similar to Ukrainians are Immigrants from Latvia (7.9%, a difference of 0.010%), Immigrants from North America (7.9%, a difference of 0.12%), Immigrants from Europe (7.9%, a difference of 0.19%), Immigrants from Croatia (7.8%, a difference of 0.24%), and English (7.9%, a difference of 0.25%).
| Demographics | Rating | Rank | Family Poverty |
| Immigrants | Canada | 98.2 /100 | #70 | Exceptional 7.8% |
| Cambodians | 98.2 /100 | #71 | Exceptional 7.8% |
| Immigrants | Romania | 98.2 /100 | #72 | Exceptional 7.8% |
| Austrians | 98.2 /100 | #73 | Exceptional 7.8% |
| Immigrants | China | 98.1 /100 | #74 | Exceptional 7.8% |
| Immigrants | Croatia | 98.1 /100 | #75 | Exceptional 7.8% |
| Immigrants | Latvia | 98.0 /100 | #76 | Exceptional 7.9% |
| Ukrainians | 98.0 /100 | #77 | Exceptional 7.9% |
| Immigrants | North America | 97.9 /100 | #78 | Exceptional 7.9% |
| Immigrants | Europe | 97.8 /100 | #79 | Exceptional 7.9% |
| English | 97.8 /100 | #80 | Exceptional 7.9% |
| Irish | 97.8 /100 | #81 | Exceptional 7.9% |
| Immigrants | Poland | 97.8 /100 | #82 | Exceptional 7.9% |
| Slovaks | 97.7 /100 | #83 | Exceptional 7.9% |
| British | 97.5 /100 | #84 | Exceptional 7.9% |