Immigrants from Indonesia vs Ukrainian Family Poverty
COMPARE
Immigrants from Indonesia
Ukrainian
Family Poverty
Family Poverty Comparison
Immigrants from Indonesia
Ukrainians
8.1%
FAMILY POVERTY
95.7/ 100
METRIC RATING
102nd/ 347
METRIC RANK
7.9%
FAMILY POVERTY
98.0/ 100
METRIC RATING
77th/ 347
METRIC RANK
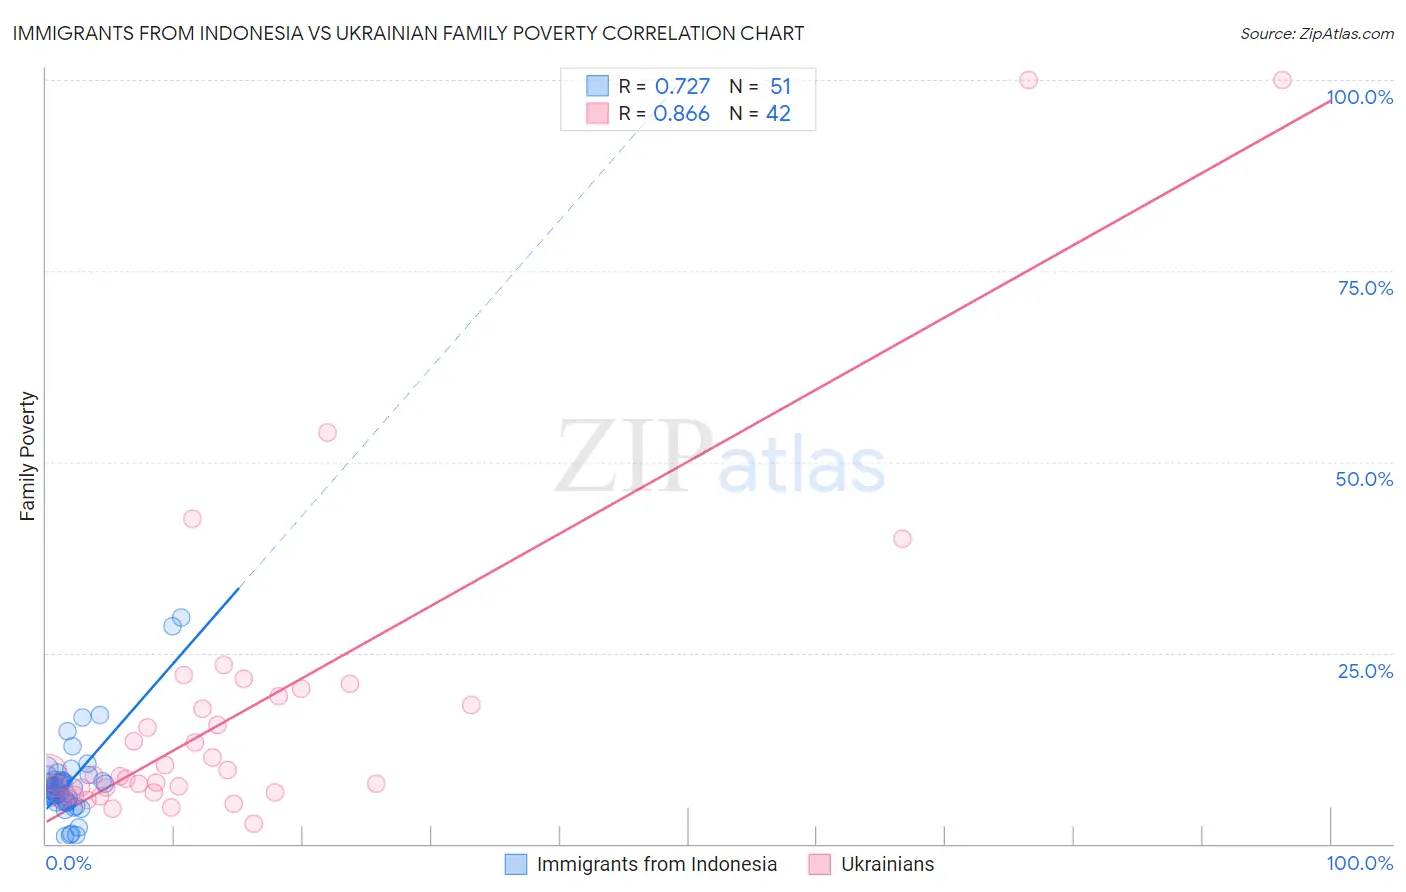
Immigrants from Indonesia vs Ukrainian Family Poverty Correlation Chart
The statistical analysis conducted on geographies consisting of 215,549,629 people shows a strong positive correlation between the proportion of Immigrants from Indonesia and poverty level among families in the United States with a correlation coefficient (R) of 0.727 and weighted average of 8.1%. Similarly, the statistical analysis conducted on geographies consisting of 446,514,525 people shows a very strong positive correlation between the proportion of Ukrainians and poverty level among families in the United States with a correlation coefficient (R) of 0.866 and weighted average of 7.9%, a difference of 2.9%.
Family Poverty Correlation Summary
| Measurement | Immigrants from Indonesia | Ukrainian |
| Minimum | 0.98% | 2.6% |
| Maximum | 29.6% | 100.0% |
| Range | 28.6% | 97.4% |
| Mean | 8.1% | 17.6% |
| Median | 7.4% | 9.2% |
| Interquartile 25% (IQ1) | 5.6% | 6.8% |
| Interquartile 75% (IQ3) | 8.4% | 19.3% |
| Interquartile Range (IQR) | 2.8% | 12.5% |
| Standard Deviation (Sample) | 5.4% | 21.5% |
| Standard Deviation (Population) | 5.3% | 21.2% |
Similar Demographics by Family Poverty
Demographics Similar to Immigrants from Indonesia by Family Poverty
In terms of family poverty, the demographic groups most similar to Immigrants from Indonesia are Immigrants from Norway (8.1%, a difference of 0.010%), New Zealander (8.1%, a difference of 0.040%), Immigrants from Eastern Europe (8.1%, a difference of 0.090%), Slavic (8.1%, a difference of 0.10%), and Welsh (8.1%, a difference of 0.11%).
| Demographics | Rating | Rank | Family Poverty |
| Immigrants | Philippines | 96.5 /100 | #95 | Exceptional 8.0% |
| Immigrants | Turkey | 96.5 /100 | #96 | Exceptional 8.0% |
| Immigrants | Switzerland | 96.1 /100 | #97 | Exceptional 8.1% |
| Immigrants | South Africa | 95.9 /100 | #98 | Exceptional 8.1% |
| Welsh | 95.8 /100 | #99 | Exceptional 8.1% |
| New Zealanders | 95.8 /100 | #100 | Exceptional 8.1% |
| Immigrants | Norway | 95.7 /100 | #101 | Exceptional 8.1% |
| Immigrants | Indonesia | 95.7 /100 | #102 | Exceptional 8.1% |
| Immigrants | Eastern Europe | 95.6 /100 | #103 | Exceptional 8.1% |
| Slavs | 95.6 /100 | #104 | Exceptional 8.1% |
| Laotians | 95.6 /100 | #105 | Exceptional 8.1% |
| Egyptians | 95.1 /100 | #106 | Exceptional 8.1% |
| French Canadians | 95.0 /100 | #107 | Exceptional 8.1% |
| Basques | 94.9 /100 | #108 | Exceptional 8.1% |
| Jordanians | 94.8 /100 | #109 | Exceptional 8.2% |
Demographics Similar to Ukrainians by Family Poverty
In terms of family poverty, the demographic groups most similar to Ukrainians are Immigrants from Latvia (7.9%, a difference of 0.010%), Immigrants from North America (7.9%, a difference of 0.12%), Immigrants from Europe (7.9%, a difference of 0.19%), Immigrants from Croatia (7.8%, a difference of 0.24%), and English (7.9%, a difference of 0.25%).
| Demographics | Rating | Rank | Family Poverty |
| Immigrants | Canada | 98.2 /100 | #70 | Exceptional 7.8% |
| Cambodians | 98.2 /100 | #71 | Exceptional 7.8% |
| Immigrants | Romania | 98.2 /100 | #72 | Exceptional 7.8% |
| Austrians | 98.2 /100 | #73 | Exceptional 7.8% |
| Immigrants | China | 98.1 /100 | #74 | Exceptional 7.8% |
| Immigrants | Croatia | 98.1 /100 | #75 | Exceptional 7.8% |
| Immigrants | Latvia | 98.0 /100 | #76 | Exceptional 7.9% |
| Ukrainians | 98.0 /100 | #77 | Exceptional 7.9% |
| Immigrants | North America | 97.9 /100 | #78 | Exceptional 7.9% |
| Immigrants | Europe | 97.8 /100 | #79 | Exceptional 7.9% |
| English | 97.8 /100 | #80 | Exceptional 7.9% |
| Irish | 97.8 /100 | #81 | Exceptional 7.9% |
| Immigrants | Poland | 97.8 /100 | #82 | Exceptional 7.9% |
| Slovaks | 97.7 /100 | #83 | Exceptional 7.9% |
| British | 97.5 /100 | #84 | Exceptional 7.9% |