Cape Verdean vs Indonesian Family Poverty
COMPARE
Cape Verdean
Indonesian
Family Poverty
Family Poverty Comparison
Cape Verdeans
Indonesians
10.9%
FAMILY POVERTY
0.1/ 100
METRIC RATING
263rd/ 347
METRIC RANK
11.3%
FAMILY POVERTY
0.0/ 100
METRIC RATING
283rd/ 347
METRIC RANK
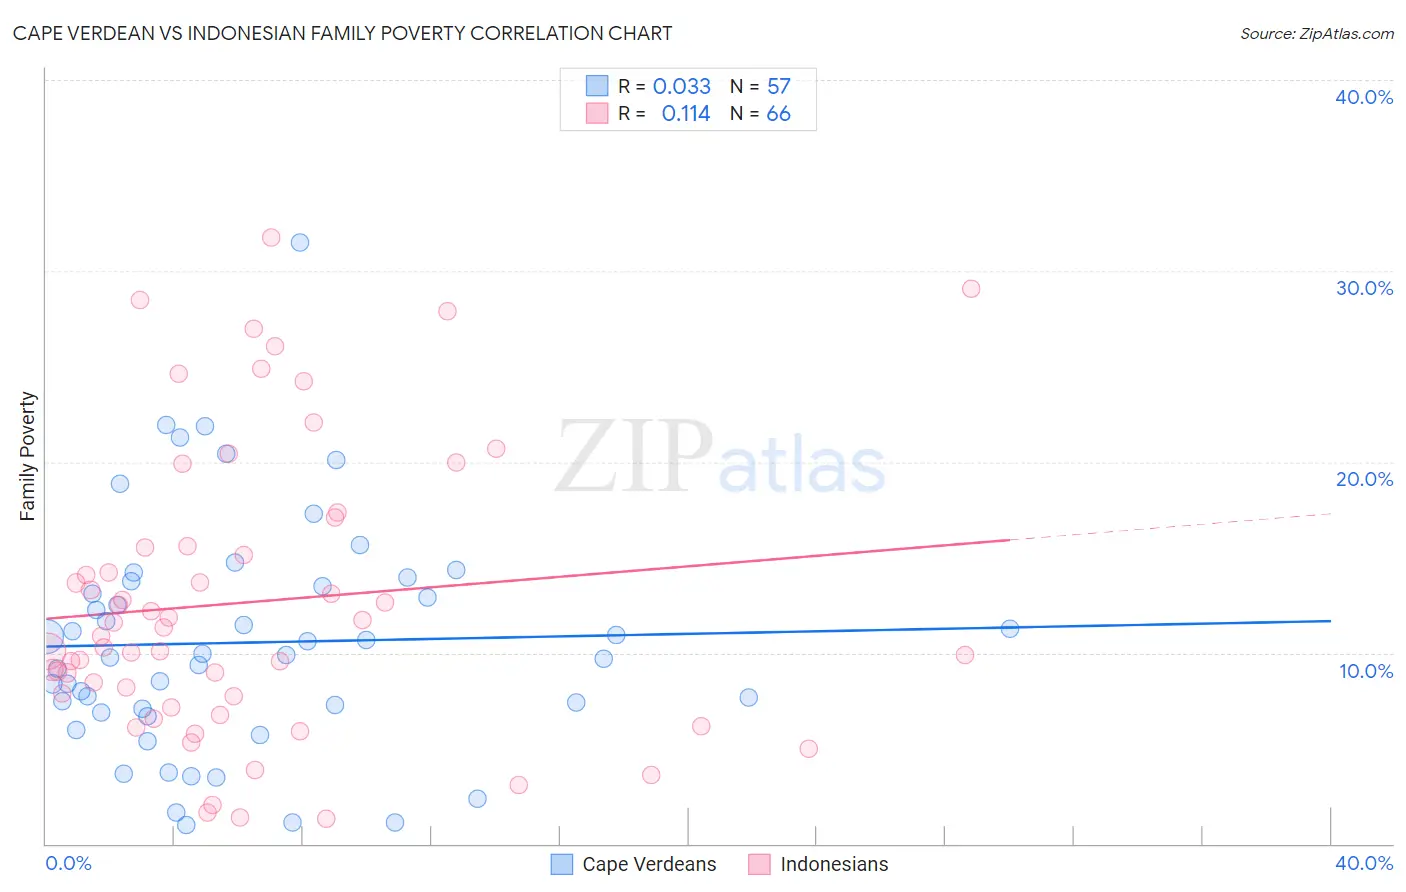
Cape Verdean vs Indonesian Family Poverty Correlation Chart
The statistical analysis conducted on geographies consisting of 107,439,266 people shows no correlation between the proportion of Cape Verdeans and poverty level among families in the United States with a correlation coefficient (R) of 0.033 and weighted average of 10.9%. Similarly, the statistical analysis conducted on geographies consisting of 162,562,549 people shows a poor positive correlation between the proportion of Indonesians and poverty level among families in the United States with a correlation coefficient (R) of 0.114 and weighted average of 11.3%, a difference of 3.5%.
Family Poverty Correlation Summary
| Measurement | Cape Verdean | Indonesian |
| Minimum | 0.95% | 1.3% |
| Maximum | 31.5% | 31.7% |
| Range | 30.5% | 30.4% |
| Mean | 10.5% | 12.7% |
| Median | 9.9% | 11.1% |
| Interquartile 25% (IQ1) | 7.0% | 7.7% |
| Interquartile 75% (IQ3) | 13.6% | 15.6% |
| Interquartile Range (IQR) | 6.6% | 7.9% |
| Standard Deviation (Sample) | 6.0% | 7.5% |
| Standard Deviation (Population) | 6.0% | 7.5% |
Demographics Similar to Cape Verdeans and Indonesians by Family Poverty
In terms of family poverty, the demographic groups most similar to Cape Verdeans are Trinidadian and Tobagonian (10.9%, a difference of 0.020%), Immigrants from Trinidad and Tobago (10.9%, a difference of 0.070%), Immigrants from El Salvador (11.0%, a difference of 0.97%), Comanche (11.0%, a difference of 0.99%), and Jamaican (11.1%, a difference of 1.1%). Similarly, the demographic groups most similar to Indonesians are Immigrants from Cuba (11.3%, a difference of 0.040%), Immigrants from West Indies (11.3%, a difference of 0.30%), Belizean (11.3%, a difference of 0.57%), Blackfeet (11.3%, a difference of 0.61%), and Guyanese (11.2%, a difference of 0.75%).
| Demographics | Rating | Rank | Family Poverty |
| Cape Verdeans | 0.1 /100 | #263 | Tragic 10.9% |
| Trinidadians and Tobagonians | 0.1 /100 | #264 | Tragic 10.9% |
| Immigrants | Trinidad and Tobago | 0.1 /100 | #265 | Tragic 10.9% |
| Immigrants | El Salvador | 0.1 /100 | #266 | Tragic 11.0% |
| Comanche | 0.1 /100 | #267 | Tragic 11.0% |
| Jamaicans | 0.1 /100 | #268 | Tragic 11.1% |
| Immigrants | Ecuador | 0.1 /100 | #269 | Tragic 11.1% |
| Immigrants | Nicaragua | 0.1 /100 | #270 | Tragic 11.1% |
| Immigrants | Bahamas | 0.1 /100 | #271 | Tragic 11.1% |
| Immigrants | Jamaica | 0.1 /100 | #272 | Tragic 11.2% |
| Somalis | 0.1 /100 | #273 | Tragic 11.2% |
| Spanish Americans | 0.1 /100 | #274 | Tragic 11.2% |
| Central Americans | 0.1 /100 | #275 | Tragic 11.2% |
| Immigrants | Guyana | 0.1 /100 | #276 | Tragic 11.2% |
| Chippewa | 0.1 /100 | #277 | Tragic 11.2% |
| Guyanese | 0.1 /100 | #278 | Tragic 11.2% |
| Blackfeet | 0.0 /100 | #279 | Tragic 11.3% |
| Belizeans | 0.0 /100 | #280 | Tragic 11.3% |
| Immigrants | West Indies | 0.0 /100 | #281 | Tragic 11.3% |
| Immigrants | Cuba | 0.0 /100 | #282 | Tragic 11.3% |
| Indonesians | 0.0 /100 | #283 | Tragic 11.3% |