Canadian vs Thai 9th Grade
COMPARE
Canadian
Thai
9th Grade
9th Grade Comparison
Canadians
Thais
95.9%
9TH GRADE
99.7/ 100
METRIC RATING
63rd/ 347
METRIC RANK
95.8%
9TH GRADE
99.5/ 100
METRIC RATING
74th/ 347
METRIC RANK
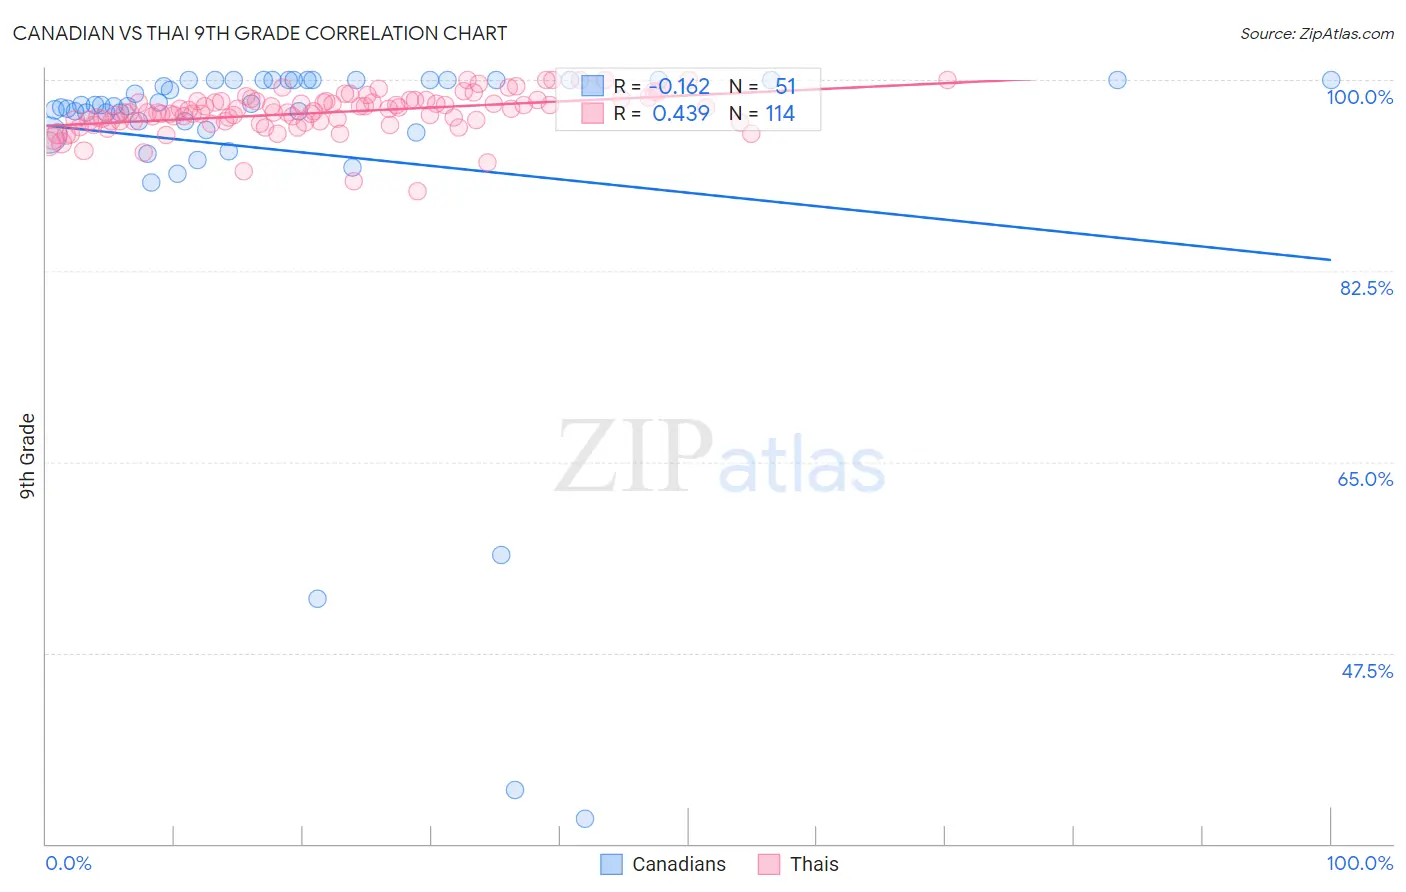
Canadian vs Thai 9th Grade Correlation Chart
The statistical analysis conducted on geographies consisting of 437,556,705 people shows a poor negative correlation between the proportion of Canadians and percentage of population with at least 9th grade education in the United States with a correlation coefficient (R) of -0.162 and weighted average of 95.9%. Similarly, the statistical analysis conducted on geographies consisting of 475,814,962 people shows a moderate positive correlation between the proportion of Thais and percentage of population with at least 9th grade education in the United States with a correlation coefficient (R) of 0.439 and weighted average of 95.8%, a difference of 0.080%.
9th Grade Correlation Summary
| Measurement | Canadian | Thai |
| Minimum | 32.3% | 89.8% |
| Maximum | 100.0% | 100.0% |
| Range | 67.7% | 10.2% |
| Mean | 93.4% | 97.0% |
| Median | 97.7% | 97.0% |
| Interquartile 25% (IQ1) | 95.4% | 96.2% |
| Interquartile 75% (IQ3) | 100.0% | 98.1% |
| Interquartile Range (IQR) | 4.6% | 1.9% |
| Standard Deviation (Sample) | 15.1% | 1.8% |
| Standard Deviation (Population) | 14.9% | 1.8% |
Demographics Similar to Canadians and Thais by 9th Grade
In terms of 9th grade, the demographic groups most similar to Canadians are Zimbabwean (95.9%, a difference of 0.010%), Immigrants from England (95.9%, a difference of 0.020%), Ukrainian (95.9%, a difference of 0.040%), Immigrants from Netherlands (95.8%, a difference of 0.040%), and Cypriot (95.8%, a difference of 0.040%). Similarly, the demographic groups most similar to Thais are Immigrants from Australia (95.8%, a difference of 0.010%), Immigrants from Belgium (95.8%, a difference of 0.010%), Turkish (95.8%, a difference of 0.010%), Immigrants from Singapore (95.8%, a difference of 0.010%), and Inupiat (95.8%, a difference of 0.010%).
| Demographics | Rating | Rank | 9th Grade |
| Aleuts | 99.8 /100 | #58 | Exceptional 96.0% |
| New Zealanders | 99.8 /100 | #59 | Exceptional 95.9% |
| Native Hawaiians | 99.8 /100 | #60 | Exceptional 95.9% |
| Sioux | 99.8 /100 | #61 | Exceptional 95.9% |
| Ukrainians | 99.7 /100 | #62 | Exceptional 95.9% |
| Canadians | 99.7 /100 | #63 | Exceptional 95.9% |
| Zimbabweans | 99.7 /100 | #64 | Exceptional 95.9% |
| Immigrants | England | 99.6 /100 | #65 | Exceptional 95.9% |
| Immigrants | Netherlands | 99.6 /100 | #66 | Exceptional 95.8% |
| Cypriots | 99.6 /100 | #67 | Exceptional 95.8% |
| Immigrants | Ireland | 99.6 /100 | #68 | Exceptional 95.8% |
| Immigrants | Lithuania | 99.6 /100 | #69 | Exceptional 95.8% |
| Immigrants | Australia | 99.5 /100 | #70 | Exceptional 95.8% |
| Immigrants | Belgium | 99.5 /100 | #71 | Exceptional 95.8% |
| Turks | 99.5 /100 | #72 | Exceptional 95.8% |
| Immigrants | Singapore | 99.5 /100 | #73 | Exceptional 95.8% |
| Thais | 99.5 /100 | #74 | Exceptional 95.8% |
| Inupiat | 99.5 /100 | #75 | Exceptional 95.8% |
| Immigrants | Sweden | 99.5 /100 | #76 | Exceptional 95.8% |
| Whites/Caucasians | 99.4 /100 | #77 | Exceptional 95.8% |
| Immigrants | South Africa | 99.4 /100 | #78 | Exceptional 95.8% |