Cambodian vs Welsh Male Poverty
COMPARE
Cambodian
Welsh
Male Poverty
Male Poverty Comparison
Cambodians
Welsh
10.4%
MALE POVERTY
95.0/ 100
METRIC RATING
88th/ 347
METRIC RANK
10.5%
MALE POVERTY
91.6/ 100
METRIC RATING
104th/ 347
METRIC RANK
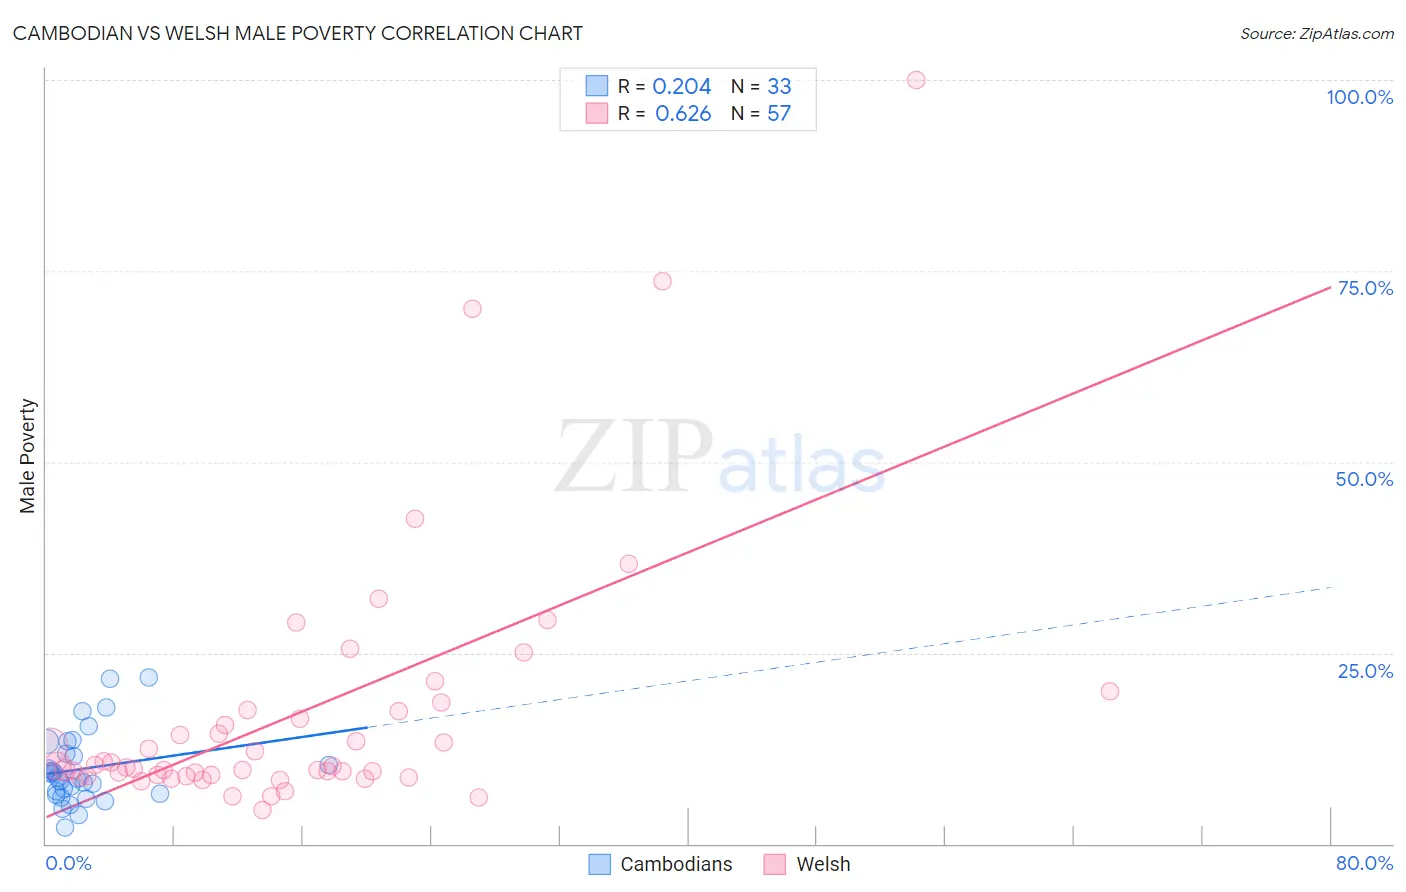
Cambodian vs Welsh Male Poverty Correlation Chart
The statistical analysis conducted on geographies consisting of 102,467,050 people shows a weak positive correlation between the proportion of Cambodians and poverty level among males in the United States with a correlation coefficient (R) of 0.204 and weighted average of 10.4%. Similarly, the statistical analysis conducted on geographies consisting of 527,618,308 people shows a significant positive correlation between the proportion of Welsh and poverty level among males in the United States with a correlation coefficient (R) of 0.626 and weighted average of 10.5%, a difference of 1.4%.
Male Poverty Correlation Summary
| Measurement | Cambodian | Welsh |
| Minimum | 2.2% | 4.4% |
| Maximum | 21.8% | 100.0% |
| Range | 19.6% | 95.6% |
| Mean | 9.8% | 17.1% |
| Median | 8.7% | 10.1% |
| Interquartile 25% (IQ1) | 6.5% | 9.0% |
| Interquartile 75% (IQ3) | 12.6% | 17.4% |
| Interquartile Range (IQR) | 6.1% | 8.5% |
| Standard Deviation (Sample) | 4.8% | 17.4% |
| Standard Deviation (Population) | 4.7% | 17.3% |
Demographics Similar to Cambodians and Welsh by Male Poverty
In terms of male poverty, the demographic groups most similar to Cambodians are Immigrants from Denmark (10.4%, a difference of 0.0%), Indian (Asian) (10.4%, a difference of 0.030%), British (10.4%, a difference of 0.10%), Northern European (10.4%, a difference of 0.14%), and Immigrants from Eastern Asia (10.4%, a difference of 0.18%). Similarly, the demographic groups most similar to Welsh are Slavic (10.5%, a difference of 0.010%), Canadian (10.5%, a difference of 0.010%), French Canadian (10.5%, a difference of 0.11%), Immigrants from Zimbabwe (10.5%, a difference of 0.12%), and Immigrants from Southern Europe (10.5%, a difference of 0.12%).
| Demographics | Rating | Rank | Male Poverty |
| Immigrants | Eastern Asia | 95.3 /100 | #86 | Exceptional 10.4% |
| Northern Europeans | 95.2 /100 | #87 | Exceptional 10.4% |
| Cambodians | 95.0 /100 | #88 | Exceptional 10.4% |
| Immigrants | Denmark | 95.0 /100 | #89 | Exceptional 10.4% |
| Indians (Asian) | 94.9 /100 | #90 | Exceptional 10.4% |
| British | 94.8 /100 | #91 | Exceptional 10.4% |
| Jordanians | 94.4 /100 | #92 | Exceptional 10.4% |
| Australians | 94.4 /100 | #93 | Exceptional 10.4% |
| Immigrants | South Africa | 94.1 /100 | #94 | Exceptional 10.4% |
| Scottish | 94.0 /100 | #95 | Exceptional 10.4% |
| Immigrants | Egypt | 93.7 /100 | #96 | Exceptional 10.4% |
| Romanians | 93.6 /100 | #97 | Exceptional 10.5% |
| Finns | 93.4 /100 | #98 | Exceptional 10.5% |
| Immigrants | Indonesia | 93.3 /100 | #99 | Exceptional 10.5% |
| Immigrants | Latvia | 92.8 /100 | #100 | Exceptional 10.5% |
| Immigrants | Zimbabwe | 92.0 /100 | #101 | Exceptional 10.5% |
| French Canadians | 91.9 /100 | #102 | Exceptional 10.5% |
| Slavs | 91.7 /100 | #103 | Exceptional 10.5% |
| Welsh | 91.6 /100 | #104 | Exceptional 10.5% |
| Canadians | 91.6 /100 | #105 | Exceptional 10.5% |
| Immigrants | Southern Europe | 91.3 /100 | #106 | Exceptional 10.5% |