British West Indian vs Immigrants from Costa Rica Child Poverty Among Boys Under 16
COMPARE
British West Indian
Immigrants from Costa Rica
Child Poverty Among Boys Under 16
Child Poverty Among Boys Under 16 Comparison
British West Indians
Immigrants from Costa Rica
21.6%
CHILD POVERTY AMONG BOYS UNDER 16
0.0/ 100
METRIC RATING
313th/ 347
METRIC RANK
16.7%
CHILD POVERTY AMONG BOYS UNDER 16
37.8/ 100
METRIC RATING
187th/ 347
METRIC RANK
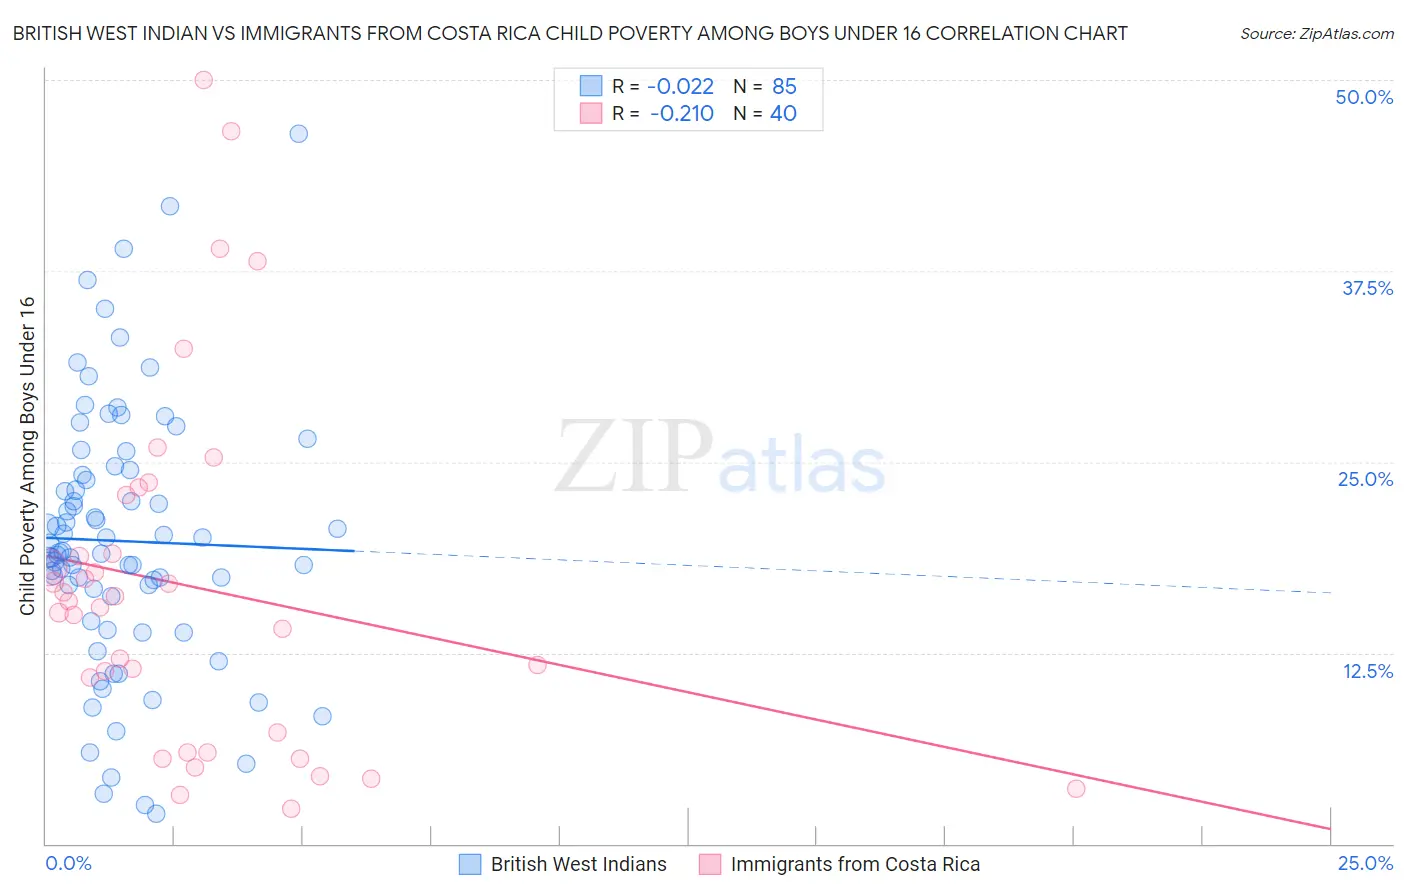
British West Indian vs Immigrants from Costa Rica Child Poverty Among Boys Under 16 Correlation Chart
The statistical analysis conducted on geographies consisting of 151,753,314 people shows no correlation between the proportion of British West Indians and poverty level among boys under the age of 16 in the United States with a correlation coefficient (R) of -0.022 and weighted average of 21.6%. Similarly, the statistical analysis conducted on geographies consisting of 202,823,387 people shows a weak negative correlation between the proportion of Immigrants from Costa Rica and poverty level among boys under the age of 16 in the United States with a correlation coefficient (R) of -0.210 and weighted average of 16.7%, a difference of 29.5%.
Child Poverty Among Boys Under 16 Correlation Summary
| Measurement | British West Indian | Immigrants from Costa Rica |
| Minimum | 2.0% | 2.3% |
| Maximum | 46.4% | 50.0% |
| Range | 44.5% | 47.7% |
| Mean | 19.8% | 16.8% |
| Median | 19.1% | 15.7% |
| Interquartile 25% (IQ1) | 15.4% | 6.6% |
| Interquartile 75% (IQ3) | 24.3% | 20.9% |
| Interquartile Range (IQR) | 8.9% | 14.3% |
| Standard Deviation (Sample) | 8.6% | 11.6% |
| Standard Deviation (Population) | 8.5% | 11.4% |
Similar Demographics by Child Poverty Among Boys Under 16
Demographics Similar to British West Indians by Child Poverty Among Boys Under 16
In terms of child poverty among boys under 16, the demographic groups most similar to British West Indians are Immigrants from Guatemala (21.6%, a difference of 0.0%), Ute (21.6%, a difference of 0.010%), Bahamian (21.6%, a difference of 0.090%), Creek (21.5%, a difference of 0.20%), and Seminole (21.5%, a difference of 0.26%).
| Demographics | Rating | Rank | Child Poverty Among Boys Under 16 |
| Immigrants | Grenada | 0.0 /100 | #306 | Tragic 21.3% |
| Choctaw | 0.0 /100 | #307 | Tragic 21.3% |
| Immigrants | Mexico | 0.0 /100 | #308 | Tragic 21.5% |
| Seminole | 0.0 /100 | #309 | Tragic 21.5% |
| Creek | 0.0 /100 | #310 | Tragic 21.5% |
| Bahamians | 0.0 /100 | #311 | Tragic 21.6% |
| Immigrants | Guatemala | 0.0 /100 | #312 | Tragic 21.6% |
| British West Indians | 0.0 /100 | #313 | Tragic 21.6% |
| Ute | 0.0 /100 | #314 | Tragic 21.6% |
| Immigrants | Somalia | 0.0 /100 | #315 | Tragic 21.7% |
| Menominee | 0.0 /100 | #316 | Tragic 21.7% |
| Africans | 0.0 /100 | #317 | Tragic 21.7% |
| Yakama | 0.0 /100 | #318 | Tragic 21.7% |
| Dutch West Indians | 0.0 /100 | #319 | Tragic 21.8% |
| U.S. Virgin Islanders | 0.0 /100 | #320 | Tragic 22.0% |
Demographics Similar to Immigrants from Costa Rica by Child Poverty Among Boys Under 16
In terms of child poverty among boys under 16, the demographic groups most similar to Immigrants from Costa Rica are Immigrants from South America (16.7%, a difference of 0.010%), Hmong (16.6%, a difference of 0.080%), Immigrants from Western Asia (16.6%, a difference of 0.30%), Celtic (16.6%, a difference of 0.33%), and Kenyan (16.6%, a difference of 0.37%).
| Demographics | Rating | Rank | Child Poverty Among Boys Under 16 |
| Hawaiians | 45.5 /100 | #180 | Average 16.5% |
| South American Indians | 44.3 /100 | #181 | Average 16.5% |
| Lebanese | 43.3 /100 | #182 | Average 16.6% |
| Kenyans | 41.0 /100 | #183 | Average 16.6% |
| Celtics | 40.6 /100 | #184 | Average 16.6% |
| Immigrants | Western Asia | 40.4 /100 | #185 | Average 16.6% |
| Hmong | 38.4 /100 | #186 | Fair 16.6% |
| Immigrants | Costa Rica | 37.8 /100 | #187 | Fair 16.7% |
| Immigrants | South America | 37.7 /100 | #188 | Fair 16.7% |
| Immigrants | Morocco | 34.5 /100 | #189 | Fair 16.7% |
| Arabs | 31.1 /100 | #190 | Fair 16.8% |
| Alaska Natives | 29.8 /100 | #191 | Fair 16.8% |
| Immigrants | Uganda | 21.6 /100 | #192 | Fair 17.0% |
| Immigrants | Iraq | 21.6 /100 | #193 | Fair 17.0% |
| Immigrants | Lebanon | 21.2 /100 | #194 | Fair 17.0% |