British West Indian vs Inupiat No Schooling Completed
COMPARE
British West Indian
Inupiat
No Schooling Completed
No Schooling Completed Comparison
British West Indians
Inupiat
2.7%
NO SCHOOLING COMPLETED
0.0/ 100
METRIC RATING
291st/ 347
METRIC RANK
1.5%
NO SCHOOLING COMPLETED
100.0/ 100
METRIC RATING
31st/ 347
METRIC RANK
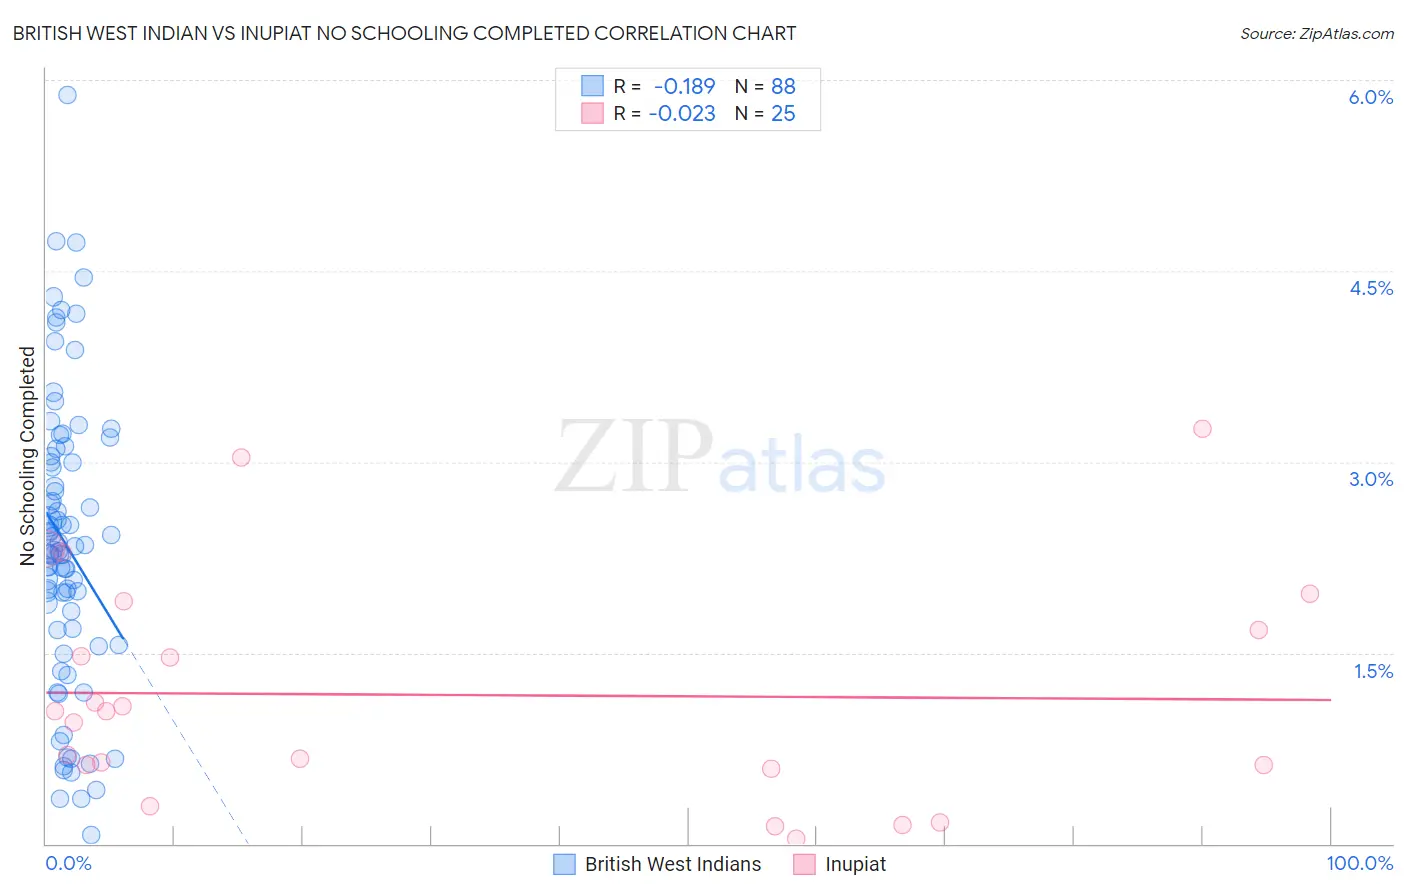
British West Indian vs Inupiat No Schooling Completed Correlation Chart
The statistical analysis conducted on geographies consisting of 152,295,928 people shows a poor negative correlation between the proportion of British West Indians and percentage of population with no schooling in the United States with a correlation coefficient (R) of -0.189 and weighted average of 2.7%. Similarly, the statistical analysis conducted on geographies consisting of 95,835,764 people shows no correlation between the proportion of Inupiat and percentage of population with no schooling in the United States with a correlation coefficient (R) of -0.023 and weighted average of 1.5%, a difference of 79.2%.
No Schooling Completed Correlation Summary
| Measurement | British West Indian | Inupiat |
| Minimum | 0.065% | 0.041% |
| Maximum | 5.9% | 3.3% |
| Range | 5.8% | 3.2% |
| Mean | 2.4% | 1.2% |
| Median | 2.3% | 1.0% |
| Interquartile 25% (IQ1) | 1.7% | 0.60% |
| Interquartile 75% (IQ3) | 3.0% | 1.8% |
| Interquartile Range (IQR) | 1.3% | 1.2% |
| Standard Deviation (Sample) | 1.1% | 0.89% |
| Standard Deviation (Population) | 1.1% | 0.87% |
Similar Demographics by No Schooling Completed
Demographics Similar to British West Indians by No Schooling Completed
In terms of no schooling completed, the demographic groups most similar to British West Indians are Immigrants from Hong Kong (2.7%, a difference of 0.89%), Immigrants from Thailand (2.7%, a difference of 0.95%), Immigrants from Grenada (2.8%, a difference of 1.1%), Immigrants from St. Vincent and the Grenadines (2.7%, a difference of 1.3%), and Immigrants from Afghanistan (2.7%, a difference of 1.4%).
| Demographics | Rating | Rank | No Schooling Completed |
| Immigrants | West Indies | 0.0 /100 | #284 | Tragic 2.7% |
| Immigrants | Barbados | 0.0 /100 | #285 | Tragic 2.7% |
| Immigrants | Portugal | 0.0 /100 | #286 | Tragic 2.7% |
| Immigrants | Afghanistan | 0.0 /100 | #287 | Tragic 2.7% |
| Immigrants | St. Vincent and the Grenadines | 0.0 /100 | #288 | Tragic 2.7% |
| Immigrants | Thailand | 0.0 /100 | #289 | Tragic 2.7% |
| Immigrants | Hong Kong | 0.0 /100 | #290 | Tragic 2.7% |
| British West Indians | 0.0 /100 | #291 | Tragic 2.7% |
| Immigrants | Grenada | 0.0 /100 | #292 | Tragic 2.8% |
| Malaysians | 0.0 /100 | #293 | Tragic 2.8% |
| Immigrants | Eritrea | 0.0 /100 | #294 | Tragic 2.8% |
| Houma | 0.0 /100 | #295 | Tragic 2.8% |
| Immigrants | Immigrants | 0.0 /100 | #296 | Tragic 2.8% |
| Immigrants | Cuba | 0.0 /100 | #297 | Tragic 2.8% |
| Immigrants | Dominica | 0.0 /100 | #298 | Tragic 2.8% |
Demographics Similar to Inupiat by No Schooling Completed
In terms of no schooling completed, the demographic groups most similar to Inupiat are British (1.5%, a difference of 0.030%), Swiss (1.5%, a difference of 0.39%), Lumbee (1.5%, a difference of 0.51%), Italian (1.5%, a difference of 1.1%), and Latvian (1.5%, a difference of 1.3%).
| Demographics | Rating | Rank | No Schooling Completed |
| Pennsylvania Germans | 100.0 /100 | #24 | Exceptional 1.5% |
| French | 100.0 /100 | #25 | Exceptional 1.5% |
| Czechs | 100.0 /100 | #26 | Exceptional 1.5% |
| Scandinavians | 100.0 /100 | #27 | Exceptional 1.5% |
| French Canadians | 100.0 /100 | #28 | Exceptional 1.5% |
| Lumbee | 100.0 /100 | #29 | Exceptional 1.5% |
| British | 100.0 /100 | #30 | Exceptional 1.5% |
| Inupiat | 100.0 /100 | #31 | Exceptional 1.5% |
| Swiss | 100.0 /100 | #32 | Exceptional 1.5% |
| Italians | 100.0 /100 | #33 | Exceptional 1.5% |
| Latvians | 100.0 /100 | #34 | Exceptional 1.5% |
| Eastern Europeans | 100.0 /100 | #35 | Exceptional 1.6% |
| Aleuts | 99.9 /100 | #36 | Exceptional 1.6% |
| Belgians | 99.9 /100 | #37 | Exceptional 1.6% |
| Northern Europeans | 99.9 /100 | #38 | Exceptional 1.6% |