Bangladeshi vs Immigrants from Argentina Child Poverty Under the Age of 5
COMPARE
Bangladeshi
Immigrants from Argentina
Child Poverty Under the Age of 5
Child Poverty Under the Age of 5 Comparison
Bangladeshis
Immigrants from Argentina
20.6%
CHILD POVERTY UNDER THE AGE OF 5
0.1/ 100
METRIC RATING
275th/ 347
METRIC RANK
15.4%
CHILD POVERTY UNDER THE AGE OF 5
98.5/ 100
METRIC RATING
75th/ 347
METRIC RANK
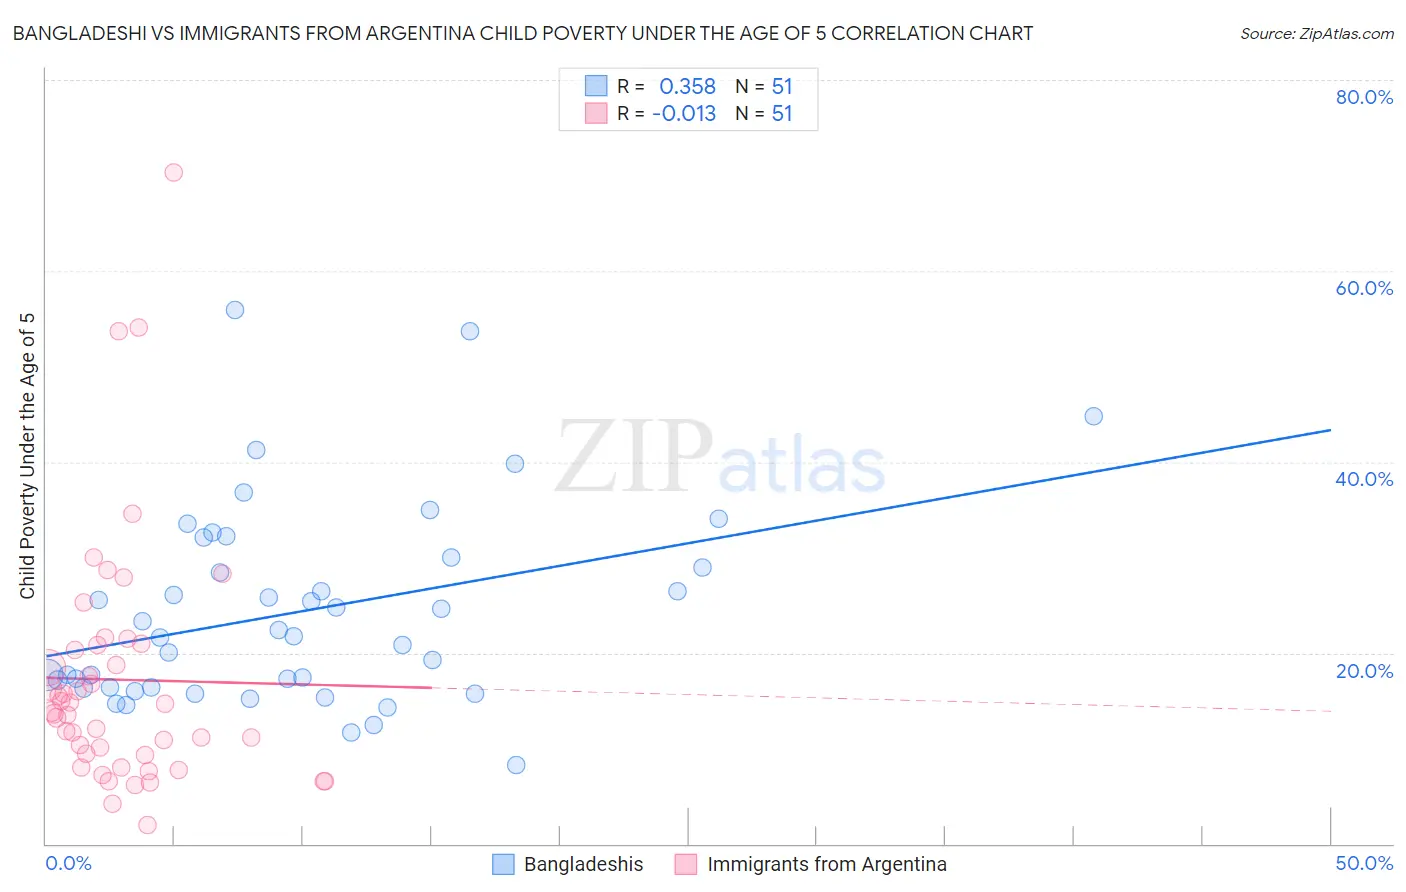
Bangladeshi vs Immigrants from Argentina Child Poverty Under the Age of 5 Correlation Chart
The statistical analysis conducted on geographies consisting of 139,356,548 people shows a mild positive correlation between the proportion of Bangladeshis and poverty level among children under the age of 5 in the United States with a correlation coefficient (R) of 0.358 and weighted average of 20.6%. Similarly, the statistical analysis conducted on geographies consisting of 256,145,971 people shows no correlation between the proportion of Immigrants from Argentina and poverty level among children under the age of 5 in the United States with a correlation coefficient (R) of -0.013 and weighted average of 15.4%, a difference of 34.2%.
Child Poverty Under the Age of 5 Correlation Summary
| Measurement | Bangladeshi | Immigrants from Argentina |
| Minimum | 8.3% | 2.0% |
| Maximum | 55.9% | 70.4% |
| Range | 47.5% | 68.4% |
| Mean | 24.3% | 17.2% |
| Median | 21.7% | 13.9% |
| Interquartile 25% (IQ1) | 16.4% | 9.3% |
| Interquartile 75% (IQ3) | 30.0% | 20.8% |
| Interquartile Range (IQR) | 13.6% | 11.5% |
| Standard Deviation (Sample) | 10.3% | 13.0% |
| Standard Deviation (Population) | 10.2% | 12.9% |
Similar Demographics by Child Poverty Under the Age of 5
Demographics Similar to Bangladeshis by Child Poverty Under the Age of 5
In terms of child poverty under the age of 5, the demographic groups most similar to Bangladeshis are Immigrants from Belize (20.6%, a difference of 0.050%), West Indian (20.6%, a difference of 0.090%), Central American (20.6%, a difference of 0.15%), Immigrants from West Indies (20.7%, a difference of 0.26%), and Immigrants from Grenada (20.7%, a difference of 0.28%).
| Demographics | Rating | Rank | Child Poverty Under the Age of 5 |
| Belizeans | 0.1 /100 | #268 | Tragic 20.3% |
| Immigrants | Burma/Myanmar | 0.1 /100 | #269 | Tragic 20.4% |
| Jamaicans | 0.1 /100 | #270 | Tragic 20.4% |
| Americans | 0.1 /100 | #271 | Tragic 20.5% |
| Immigrants | Jamaica | 0.1 /100 | #272 | Tragic 20.5% |
| Central Americans | 0.1 /100 | #273 | Tragic 20.6% |
| Immigrants | Belize | 0.1 /100 | #274 | Tragic 20.6% |
| Bangladeshis | 0.1 /100 | #275 | Tragic 20.6% |
| West Indians | 0.0 /100 | #276 | Tragic 20.6% |
| Immigrants | West Indies | 0.0 /100 | #277 | Tragic 20.7% |
| Immigrants | Grenada | 0.0 /100 | #278 | Tragic 20.7% |
| Sub-Saharan Africans | 0.0 /100 | #279 | Tragic 20.8% |
| French American Indians | 0.0 /100 | #280 | Tragic 20.8% |
| Senegalese | 0.0 /100 | #281 | Tragic 20.9% |
| Potawatomi | 0.0 /100 | #282 | Tragic 21.0% |
Demographics Similar to Immigrants from Argentina by Child Poverty Under the Age of 5
In terms of child poverty under the age of 5, the demographic groups most similar to Immigrants from Argentina are Croatian (15.4%, a difference of 0.0%), Argentinean (15.4%, a difference of 0.15%), Immigrants from Turkey (15.4%, a difference of 0.21%), Immigrants from Ukraine (15.3%, a difference of 0.51%), and Sri Lankan (15.5%, a difference of 0.54%).
| Demographics | Rating | Rank | Child Poverty Under the Age of 5 |
| Zimbabweans | 99.0 /100 | #68 | Exceptional 15.2% |
| Lithuanians | 99.0 /100 | #69 | Exceptional 15.2% |
| Immigrants | Belgium | 98.8 /100 | #70 | Exceptional 15.3% |
| Immigrants | Egypt | 98.8 /100 | #71 | Exceptional 15.3% |
| Immigrants | Sweden | 98.8 /100 | #72 | Exceptional 15.3% |
| Immigrants | Ukraine | 98.7 /100 | #73 | Exceptional 15.3% |
| Argentineans | 98.5 /100 | #74 | Exceptional 15.4% |
| Immigrants | Argentina | 98.5 /100 | #75 | Exceptional 15.4% |
| Croatians | 98.5 /100 | #76 | Exceptional 15.4% |
| Immigrants | Turkey | 98.3 /100 | #77 | Exceptional 15.4% |
| Sri Lankans | 98.1 /100 | #78 | Exceptional 15.5% |
| Australians | 98.0 /100 | #79 | Exceptional 15.5% |
| Italians | 97.9 /100 | #80 | Exceptional 15.5% |
| Czechs | 97.8 /100 | #81 | Exceptional 15.5% |
| Immigrants | Italy | 97.7 /100 | #82 | Exceptional 15.6% |