British vs Immigrants from Middle Africa Unemployment Among Ages 20 to 24 years
COMPARE
British
Immigrants from Middle Africa
Unemployment Among Ages 20 to 24 years
Unemployment Among Ages 20 to 24 years Comparison
British
Immigrants from Middle Africa
9.8%
UNEMPLOYMENT AMONG AGES 20 TO 24 YEARS
99.4/ 100
METRIC RATING
63rd/ 347
METRIC RANK
10.4%
UNEMPLOYMENT AMONG AGES 20 TO 24 YEARS
20.9/ 100
METRIC RATING
202nd/ 347
METRIC RANK
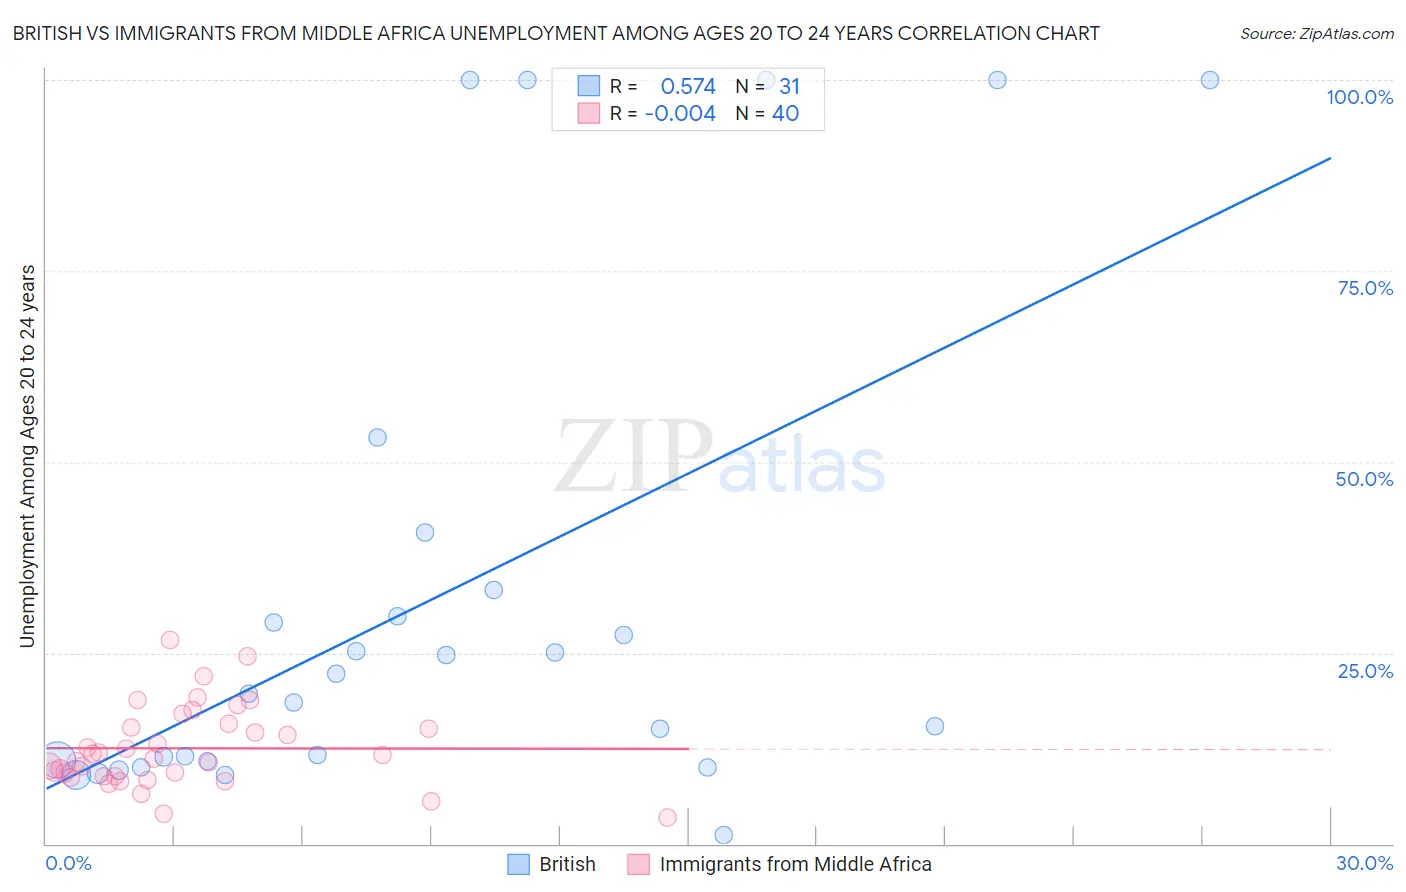
British vs Immigrants from Middle Africa Unemployment Among Ages 20 to 24 years Correlation Chart
The statistical analysis conducted on geographies consisting of 495,891,329 people shows a substantial positive correlation between the proportion of British and unemployment rate among population between the ages 20 and 24 in the United States with a correlation coefficient (R) of 0.574 and weighted average of 9.8%. Similarly, the statistical analysis conducted on geographies consisting of 200,508,228 people shows no correlation between the proportion of Immigrants from Middle Africa and unemployment rate among population between the ages 20 and 24 in the United States with a correlation coefficient (R) of -0.004 and weighted average of 10.4%, a difference of 6.2%.
Unemployment Among Ages 20 to 24 years Correlation Summary
| Measurement | British | Immigrants from Middle Africa |
| Minimum | 1.1% | 3.4% |
| Maximum | 100.0% | 26.7% |
| Range | 98.9% | 23.3% |
| Mean | 32.0% | 12.5% |
| Median | 19.6% | 11.3% |
| Interquartile 25% (IQ1) | 10.9% | 8.8% |
| Interquartile 75% (IQ3) | 33.3% | 15.5% |
| Interquartile Range (IQR) | 22.4% | 6.6% |
| Standard Deviation (Sample) | 32.1% | 5.3% |
| Standard Deviation (Population) | 31.6% | 5.2% |
Similar Demographics by Unemployment Among Ages 20 to 24 years
Demographics Similar to British by Unemployment Among Ages 20 to 24 years
In terms of unemployment among ages 20 to 24 years, the demographic groups most similar to British are Serbian (9.8%, a difference of 0.0%), Immigrants from Singapore (9.8%, a difference of 0.010%), Welsh (9.8%, a difference of 0.070%), Malaysian (9.8%, a difference of 0.11%), and Immigrants from Kuwait (9.8%, a difference of 0.13%).
| Demographics | Rating | Rank | Unemployment Among Ages 20 to 24 years |
| Nicaraguans | 99.6 /100 | #56 | Exceptional 9.8% |
| Immigrants | Moldova | 99.5 /100 | #57 | Exceptional 9.8% |
| Pakistanis | 99.5 /100 | #58 | Exceptional 9.8% |
| English | 99.5 /100 | #59 | Exceptional 9.8% |
| Immigrants | Kuwait | 99.5 /100 | #60 | Exceptional 9.8% |
| Malaysians | 99.5 /100 | #61 | Exceptional 9.8% |
| Immigrants | Singapore | 99.4 /100 | #62 | Exceptional 9.8% |
| British | 99.4 /100 | #63 | Exceptional 9.8% |
| Serbians | 99.4 /100 | #64 | Exceptional 9.8% |
| Welsh | 99.3 /100 | #65 | Exceptional 9.8% |
| Scottish | 99.3 /100 | #66 | Exceptional 9.8% |
| Immigrants | Bolivia | 99.2 /100 | #67 | Exceptional 9.9% |
| Mongolians | 99.1 /100 | #68 | Exceptional 9.9% |
| Bulgarians | 99.1 /100 | #69 | Exceptional 9.9% |
| Immigrants | Croatia | 99.0 /100 | #70 | Exceptional 9.9% |
Demographics Similar to Immigrants from Middle Africa by Unemployment Among Ages 20 to 24 years
In terms of unemployment among ages 20 to 24 years, the demographic groups most similar to Immigrants from Middle Africa are Russian (10.4%, a difference of 0.020%), Immigrants from Peru (10.4%, a difference of 0.020%), South American (10.4%, a difference of 0.020%), Portuguese (10.4%, a difference of 0.050%), and Colombian (10.4%, a difference of 0.080%).
| Demographics | Rating | Rank | Unemployment Among Ages 20 to 24 years |
| Egyptians | 24.5 /100 | #195 | Fair 10.4% |
| Immigrants | Philippines | 24.1 /100 | #196 | Fair 10.4% |
| Immigrants | Denmark | 22.8 /100 | #197 | Fair 10.4% |
| Colombians | 22.3 /100 | #198 | Fair 10.4% |
| Portuguese | 21.8 /100 | #199 | Fair 10.4% |
| Russians | 21.2 /100 | #200 | Fair 10.4% |
| Immigrants | Peru | 21.2 /100 | #201 | Fair 10.4% |
| Immigrants | Middle Africa | 20.9 /100 | #202 | Fair 10.4% |
| South Americans | 20.6 /100 | #203 | Fair 10.4% |
| Immigrants | Northern Europe | 19.5 /100 | #204 | Poor 10.4% |
| Cypriots | 18.9 /100 | #205 | Poor 10.4% |
| Immigrants | Europe | 18.5 /100 | #206 | Poor 10.4% |
| Immigrants | Honduras | 17.9 /100 | #207 | Poor 10.4% |
| Immigrants | Hong Kong | 17.6 /100 | #208 | Poor 10.5% |
| Peruvians | 17.2 /100 | #209 | Poor 10.5% |