South American vs Immigrants from Italy Single Mother Poverty
COMPARE
South American
Immigrants from Italy
Single Mother Poverty
Single Mother Poverty Comparison
South Americans
Immigrants from Italy
28.4%
SINGLE MOTHER POVERTY
90.4/ 100
METRIC RATING
129th/ 347
METRIC RANK
27.5%
SINGLE MOTHER POVERTY
99.1/ 100
METRIC RATING
79th/ 347
METRIC RANK
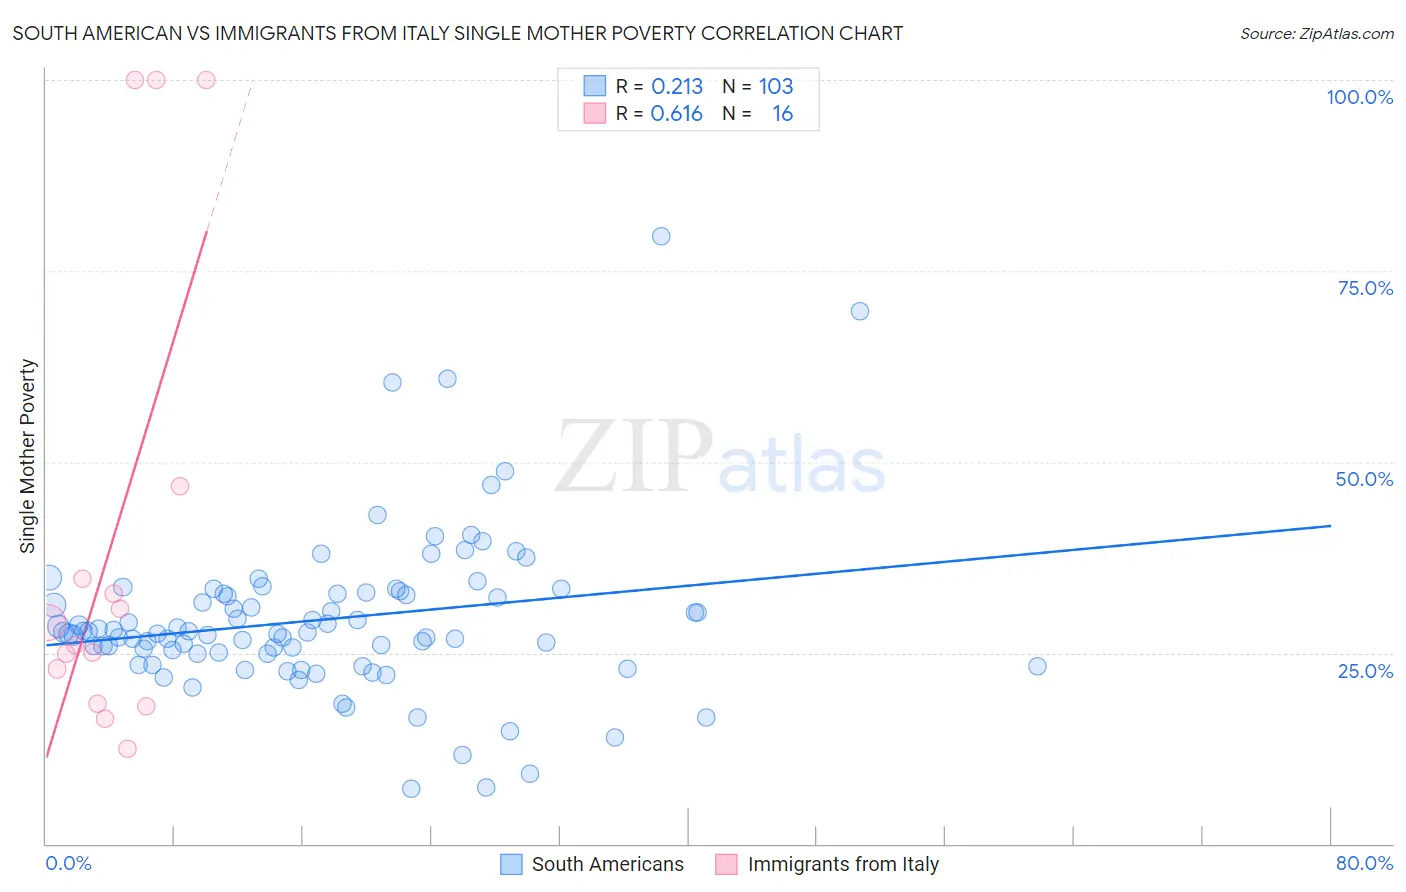
South American vs Immigrants from Italy Single Mother Poverty Correlation Chart
The statistical analysis conducted on geographies consisting of 477,647,095 people shows a weak positive correlation between the proportion of South Americans and poverty level among single mothers in the United States with a correlation coefficient (R) of 0.213 and weighted average of 28.4%. Similarly, the statistical analysis conducted on geographies consisting of 315,189,734 people shows a significant positive correlation between the proportion of Immigrants from Italy and poverty level among single mothers in the United States with a correlation coefficient (R) of 0.616 and weighted average of 27.5%, a difference of 3.2%.
Single Mother Poverty Correlation Summary
| Measurement | South American | Immigrants from Italy |
| Minimum | 7.3% | 12.5% |
| Maximum | 79.6% | 100.0% |
| Range | 72.3% | 87.5% |
| Mean | 29.3% | 39.9% |
| Median | 27.6% | 27.5% |
| Interquartile 25% (IQ1) | 24.9% | 20.6% |
| Interquartile 75% (IQ3) | 32.8% | 40.7% |
| Interquartile Range (IQR) | 7.9% | 20.1% |
| Standard Deviation (Sample) | 10.7% | 30.9% |
| Standard Deviation (Population) | 10.6% | 29.9% |
Similar Demographics by Single Mother Poverty
Demographics Similar to South Americans by Single Mother Poverty
In terms of single mother poverty, the demographic groups most similar to South Americans are Norwegian (28.4%, a difference of 0.0%), Immigrants from England (28.4%, a difference of 0.020%), Immigrants from Austria (28.4%, a difference of 0.020%), Polish (28.4%, a difference of 0.060%), and Kenyan (28.4%, a difference of 0.070%).
| Demographics | Rating | Rank | Single Mother Poverty |
| Colombians | 91.8 /100 | #122 | Exceptional 28.3% |
| Uruguayans | 91.7 /100 | #123 | Exceptional 28.3% |
| Immigrants | Switzerland | 91.7 /100 | #124 | Exceptional 28.3% |
| Kenyans | 90.9 /100 | #125 | Exceptional 28.4% |
| Immigrants | Chile | 90.8 /100 | #126 | Exceptional 28.4% |
| Poles | 90.8 /100 | #127 | Exceptional 28.4% |
| Immigrants | England | 90.5 /100 | #128 | Exceptional 28.4% |
| South Americans | 90.4 /100 | #129 | Exceptional 28.4% |
| Norwegians | 90.4 /100 | #130 | Exceptional 28.4% |
| Immigrants | Austria | 90.3 /100 | #131 | Exceptional 28.4% |
| Immigrants | Morocco | 89.5 /100 | #132 | Excellent 28.4% |
| Swedes | 89.4 /100 | #133 | Excellent 28.4% |
| Immigrants | Southern Europe | 89.2 /100 | #134 | Excellent 28.4% |
| Immigrants | Spain | 89.2 /100 | #135 | Excellent 28.4% |
| Native Hawaiians | 88.9 /100 | #136 | Excellent 28.4% |
Demographics Similar to Immigrants from Italy by Single Mother Poverty
In terms of single mother poverty, the demographic groups most similar to Immigrants from Italy are Taiwanese (27.5%, a difference of 0.0%), Immigrants from North Macedonia (27.5%, a difference of 0.030%), Immigrants from Peru (27.5%, a difference of 0.050%), Peruvian (27.5%, a difference of 0.070%), and Immigrants from Sweden (27.5%, a difference of 0.11%).
| Demographics | Rating | Rank | Single Mother Poverty |
| Immigrants | Russia | 99.4 /100 | #72 | Exceptional 27.4% |
| Sierra Leoneans | 99.3 /100 | #73 | Exceptional 27.4% |
| Immigrants | Europe | 99.3 /100 | #74 | Exceptional 27.4% |
| Immigrants | Sweden | 99.2 /100 | #75 | Exceptional 27.5% |
| Peruvians | 99.2 /100 | #76 | Exceptional 27.5% |
| Immigrants | Peru | 99.2 /100 | #77 | Exceptional 27.5% |
| Immigrants | North Macedonia | 99.2 /100 | #78 | Exceptional 27.5% |
| Immigrants | Italy | 99.1 /100 | #79 | Exceptional 27.5% |
| Taiwanese | 99.1 /100 | #80 | Exceptional 27.5% |
| Immigrants | Scotland | 98.9 /100 | #81 | Exceptional 27.6% |
| Immigrants | Cameroon | 98.8 /100 | #82 | Exceptional 27.6% |
| Greeks | 98.7 /100 | #83 | Exceptional 27.7% |
| Immigrants | Latvia | 98.7 /100 | #84 | Exceptional 27.7% |
| Mongolians | 98.7 /100 | #85 | Exceptional 27.7% |
| Immigrants | Ukraine | 98.6 /100 | #86 | Exceptional 27.7% |