Brazilian vs Immigrants from Argentina 12th Grade, No Diploma
COMPARE
Brazilian
Immigrants from Argentina
12th Grade, No Diploma
12th Grade, No Diploma Comparison
Brazilians
Immigrants from Argentina
91.3%
12TH GRADE, NO DIPLOMA
62.0/ 100
METRIC RATING
162nd/ 347
METRIC RANK
91.6%
12TH GRADE, NO DIPLOMA
80.7/ 100
METRIC RATING
143rd/ 347
METRIC RANK
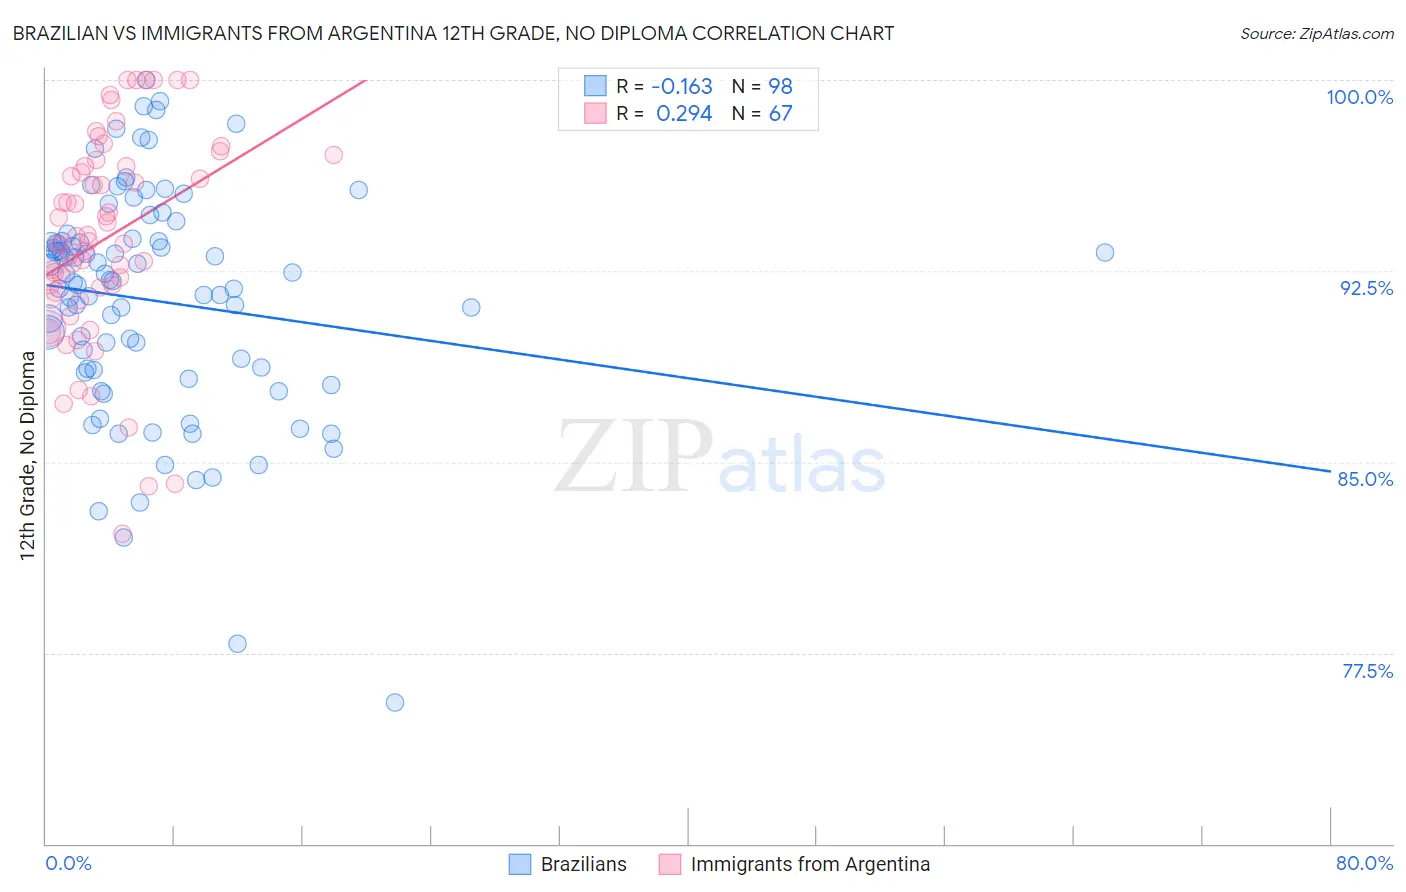
Brazilian vs Immigrants from Argentina 12th Grade, No Diploma Correlation Chart
The statistical analysis conducted on geographies consisting of 323,949,472 people shows a poor negative correlation between the proportion of Brazilians and percentage of population with at least 12th grade (no diploma) education in the United States with a correlation coefficient (R) of -0.163 and weighted average of 91.3%. Similarly, the statistical analysis conducted on geographies consisting of 264,434,241 people shows a weak positive correlation between the proportion of Immigrants from Argentina and percentage of population with at least 12th grade (no diploma) education in the United States with a correlation coefficient (R) of 0.294 and weighted average of 91.6%, a difference of 0.29%.
12th Grade, No Diploma Correlation Summary
| Measurement | Brazilian | Immigrants from Argentina |
| Minimum | 75.6% | 82.2% |
| Maximum | 100.0% | 100.0% |
| Range | 24.4% | 17.8% |
| Mean | 91.3% | 93.8% |
| Median | 92.1% | 93.7% |
| Interquartile 25% (IQ1) | 88.6% | 91.7% |
| Interquartile 75% (IQ3) | 93.6% | 96.6% |
| Interquartile Range (IQR) | 5.0% | 4.9% |
| Standard Deviation (Sample) | 4.5% | 4.1% |
| Standard Deviation (Population) | 4.5% | 4.0% |
Demographics Similar to Brazilians and Immigrants from Argentina by 12th Grade, No Diploma
In terms of 12th grade, no diploma, the demographic groups most similar to Brazilians are Immigrants from Hong Kong (91.3%, a difference of 0.020%), Laotian (91.3%, a difference of 0.030%), Immigrants from Albania (91.3%, a difference of 0.030%), Immigrants from Northern Africa (91.4%, a difference of 0.060%), and Immigrants from Pakistan (91.4%, a difference of 0.12%). Similarly, the demographic groups most similar to Immigrants from Argentina are Immigrants from Venezuela (91.6%, a difference of 0.0%), Immigrants from Spain (91.6%, a difference of 0.010%), Immigrants from Lebanon (91.6%, a difference of 0.010%), Immigrants from Brazil (91.5%, a difference of 0.020%), and Pakistani (91.5%, a difference of 0.020%).
| Demographics | Rating | Rank | 12th Grade, No Diploma |
| Immigrants | Venezuela | 80.9 /100 | #142 | Excellent 91.6% |
| Immigrants | Argentina | 80.7 /100 | #143 | Excellent 91.6% |
| Immigrants | Spain | 80.1 /100 | #144 | Excellent 91.6% |
| Immigrants | Lebanon | 80.0 /100 | #145 | Excellent 91.6% |
| Immigrants | Brazil | 79.8 /100 | #146 | Good 91.5% |
| Pakistanis | 79.6 /100 | #147 | Good 91.5% |
| Indians (Asian) | 79.4 /100 | #148 | Good 91.5% |
| Ugandans | 79.0 /100 | #149 | Good 91.5% |
| Paraguayans | 78.9 /100 | #150 | Good 91.5% |
| Chippewa | 78.8 /100 | #151 | Good 91.5% |
| Kenyans | 77.4 /100 | #152 | Good 91.5% |
| Iraqis | 75.3 /100 | #153 | Good 91.5% |
| Immigrants | Kenya | 73.9 /100 | #154 | Good 91.5% |
| Immigrants | Iraq | 73.0 /100 | #155 | Good 91.4% |
| Asians | 71.9 /100 | #156 | Good 91.4% |
| Immigrants | Pakistan | 70.7 /100 | #157 | Good 91.4% |
| Immigrants | Northern Africa | 66.2 /100 | #158 | Good 91.4% |
| Laotians | 64.4 /100 | #159 | Good 91.3% |
| Immigrants | Albania | 64.1 /100 | #160 | Good 91.3% |
| Immigrants | Hong Kong | 63.8 /100 | #161 | Good 91.3% |
| Brazilians | 62.0 /100 | #162 | Good 91.3% |