Brazilian vs Immigrants from Argentina Vision Disability
COMPARE
Brazilian
Immigrants from Argentina
Vision Disability
Vision Disability Comparison
Brazilians
Immigrants from Argentina
2.1%
VISION DISABILITY
62.2/ 100
METRIC RATING
168th/ 347
METRIC RANK
2.0%
VISION DISABILITY
98.9/ 100
METRIC RATING
66th/ 347
METRIC RANK
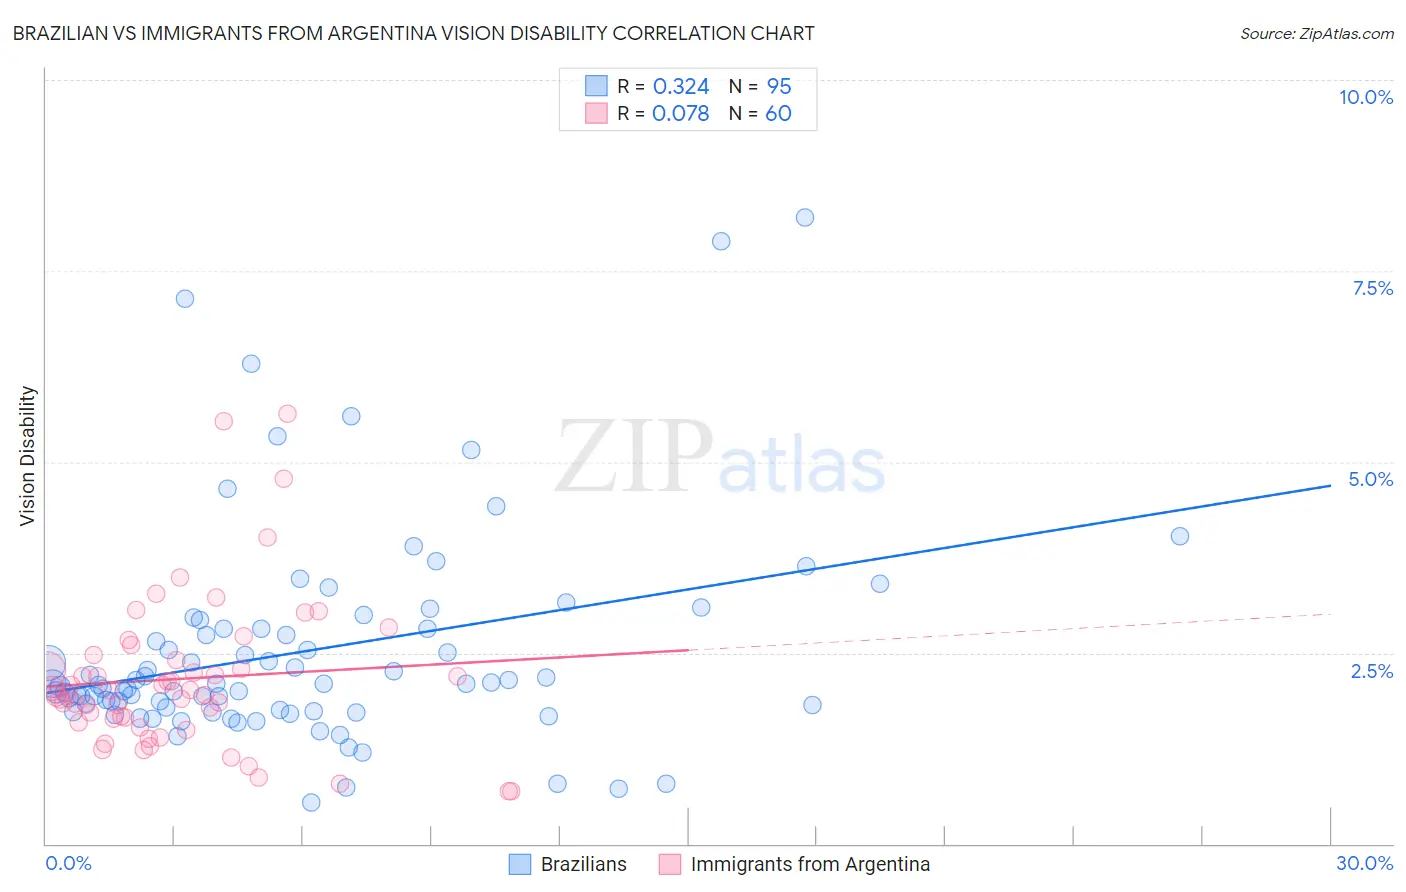
Brazilian vs Immigrants from Argentina Vision Disability Correlation Chart
The statistical analysis conducted on geographies consisting of 323,719,841 people shows a mild positive correlation between the proportion of Brazilians and percentage of population with vision disability in the United States with a correlation coefficient (R) of 0.324 and weighted average of 2.1%. Similarly, the statistical analysis conducted on geographies consisting of 264,359,612 people shows a slight positive correlation between the proportion of Immigrants from Argentina and percentage of population with vision disability in the United States with a correlation coefficient (R) of 0.078 and weighted average of 2.0%, a difference of 6.7%.
Vision Disability Correlation Summary
| Measurement | Brazilian | Immigrants from Argentina |
| Minimum | 0.54% | 0.68% |
| Maximum | 8.2% | 5.6% |
| Range | 7.7% | 4.9% |
| Mean | 2.5% | 2.2% |
| Median | 2.1% | 2.0% |
| Interquartile 25% (IQ1) | 1.7% | 1.6% |
| Interquartile 75% (IQ3) | 2.8% | 2.4% |
| Interquartile Range (IQR) | 1.1% | 0.82% |
| Standard Deviation (Sample) | 1.4% | 1.0% |
| Standard Deviation (Population) | 1.4% | 0.99% |
Similar Demographics by Vision Disability
Demographics Similar to Brazilians by Vision Disability
In terms of vision disability, the demographic groups most similar to Brazilians are Immigrants from Africa (2.1%, a difference of 0.030%), Immigrants from England (2.1%, a difference of 0.040%), Immigrants from Iraq (2.1%, a difference of 0.18%), Immigrants from Bangladesh (2.1%, a difference of 0.23%), and Icelander (2.1%, a difference of 0.27%).
| Demographics | Rating | Rank | Vision Disability |
| Iraqis | 67.7 /100 | #161 | Good 2.1% |
| Hungarians | 67.4 /100 | #162 | Good 2.1% |
| Icelanders | 66.1 /100 | #163 | Good 2.1% |
| Immigrants | Bangladesh | 65.5 /100 | #164 | Good 2.1% |
| Immigrants | Iraq | 64.8 /100 | #165 | Good 2.1% |
| Immigrants | England | 62.8 /100 | #166 | Good 2.1% |
| Immigrants | Africa | 62.6 /100 | #167 | Good 2.1% |
| Brazilians | 62.2 /100 | #168 | Good 2.1% |
| South American Indians | 57.4 /100 | #169 | Average 2.2% |
| Swiss | 55.7 /100 | #170 | Average 2.2% |
| Lebanese | 54.3 /100 | #171 | Average 2.2% |
| Northern Europeans | 50.1 /100 | #172 | Average 2.2% |
| Scandinavians | 50.0 /100 | #173 | Average 2.2% |
| Immigrants | Canada | 50.0 /100 | #174 | Average 2.2% |
| Immigrants | Fiji | 47.6 /100 | #175 | Average 2.2% |
Demographics Similar to Immigrants from Argentina by Vision Disability
In terms of vision disability, the demographic groups most similar to Immigrants from Argentina are Maltese (2.0%, a difference of 0.060%), Immigrants from Northern Africa (2.0%, a difference of 0.11%), Immigrants from Greece (2.0%, a difference of 0.13%), Immigrants from Czechoslovakia (2.0%, a difference of 0.21%), and Armenian (2.0%, a difference of 0.26%).
| Demographics | Rating | Rank | Vision Disability |
| Argentineans | 99.1 /100 | #59 | Exceptional 2.0% |
| Immigrants | Romania | 99.1 /100 | #60 | Exceptional 2.0% |
| Immigrants | Belgium | 99.1 /100 | #61 | Exceptional 2.0% |
| Immigrants | Russia | 99.1 /100 | #62 | Exceptional 2.0% |
| Armenians | 99.0 /100 | #63 | Exceptional 2.0% |
| Immigrants | Greece | 99.0 /100 | #64 | Exceptional 2.0% |
| Maltese | 98.9 /100 | #65 | Exceptional 2.0% |
| Immigrants | Argentina | 98.9 /100 | #66 | Exceptional 2.0% |
| Immigrants | Northern Africa | 98.8 /100 | #67 | Exceptional 2.0% |
| Immigrants | Czechoslovakia | 98.7 /100 | #68 | Exceptional 2.0% |
| Russians | 98.6 /100 | #69 | Exceptional 2.0% |
| Immigrants | Kazakhstan | 98.6 /100 | #70 | Exceptional 2.0% |
| Immigrants | Northern Europe | 98.6 /100 | #71 | Exceptional 2.0% |
| Immigrants | France | 98.5 /100 | #72 | Exceptional 2.0% |
| Immigrants | Eritrea | 98.4 /100 | #73 | Exceptional 2.0% |