Bolivian vs Chilean 4th Grade
COMPARE
Bolivian
Chilean
4th Grade
4th Grade Comparison
Bolivians
Chileans
97.1%
4TH GRADE
0.7/ 100
METRIC RATING
256th/ 347
METRIC RANK
97.5%
4TH GRADE
54.4/ 100
METRIC RATING
169th/ 347
METRIC RANK
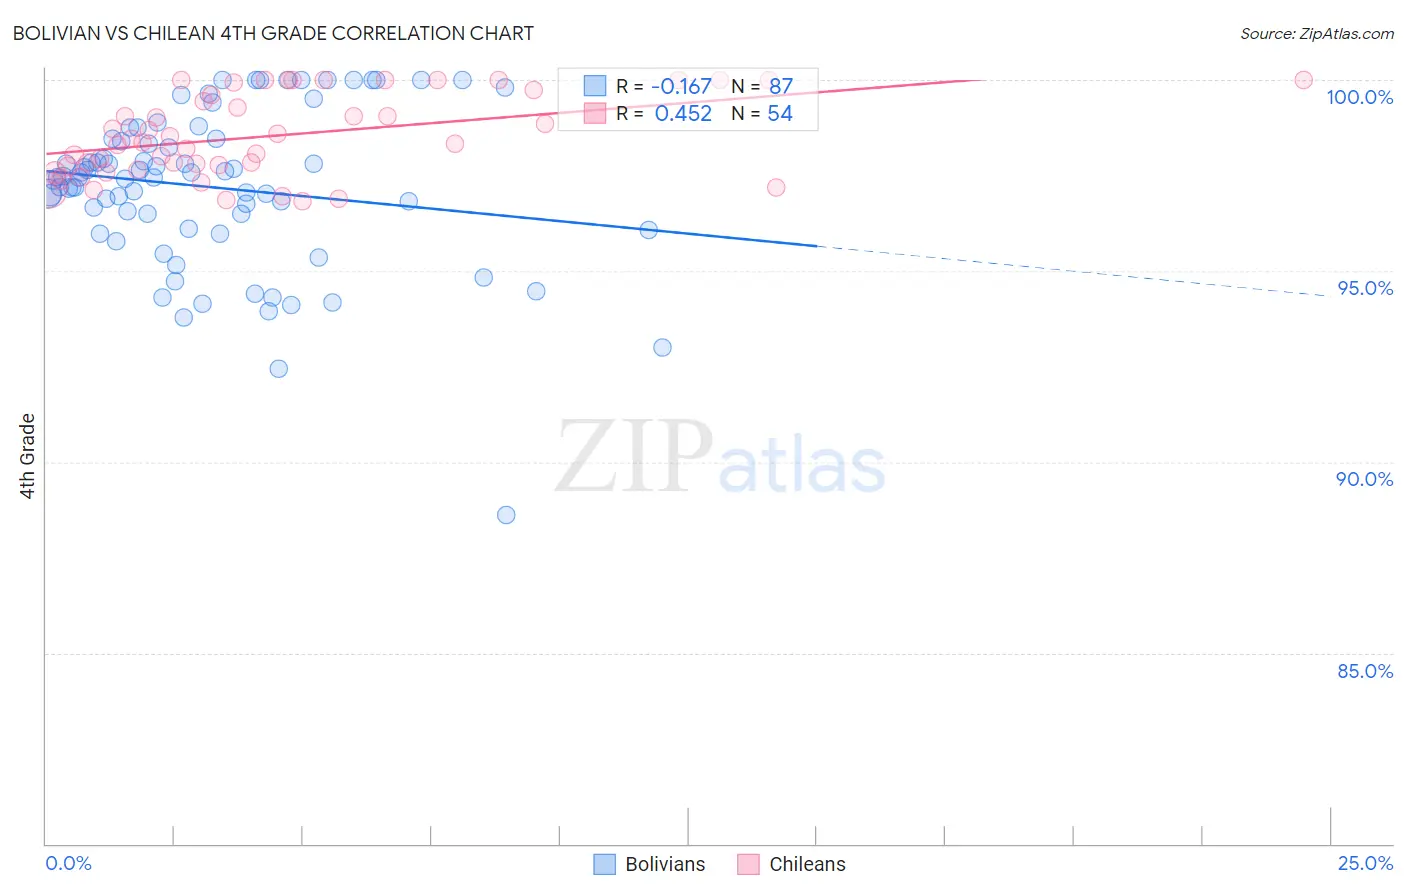
Bolivian vs Chilean 4th Grade Correlation Chart
The statistical analysis conducted on geographies consisting of 184,667,361 people shows a poor negative correlation between the proportion of Bolivians and percentage of population with at least 4th grade education in the United States with a correlation coefficient (R) of -0.167 and weighted average of 97.1%. Similarly, the statistical analysis conducted on geographies consisting of 256,683,580 people shows a moderate positive correlation between the proportion of Chileans and percentage of population with at least 4th grade education in the United States with a correlation coefficient (R) of 0.452 and weighted average of 97.5%, a difference of 0.49%.
4th Grade Correlation Summary
| Measurement | Bolivian | Chilean |
| Minimum | 88.6% | 96.8% |
| Maximum | 100.0% | 100.0% |
| Range | 11.4% | 3.2% |
| Mean | 97.2% | 98.6% |
| Median | 97.4% | 98.4% |
| Interquartile 25% (IQ1) | 96.1% | 97.7% |
| Interquartile 75% (IQ3) | 98.4% | 99.8% |
| Interquartile Range (IQR) | 2.4% | 2.0% |
| Standard Deviation (Sample) | 2.1% | 1.1% |
| Standard Deviation (Population) | 2.1% | 1.1% |
Similar Demographics by 4th Grade
Demographics Similar to Bolivians by 4th Grade
In terms of 4th grade, the demographic groups most similar to Bolivians are Peruvian (97.1%, a difference of 0.0%), Immigrants from Middle Africa (97.1%, a difference of 0.010%), South American (97.1%, a difference of 0.020%), Jamaican (97.1%, a difference of 0.020%), and Immigrants from Liberia (97.1%, a difference of 0.020%).
| Demographics | Rating | Rank | 4th Grade |
| Immigrants | Africa | 1.0 /100 | #249 | Tragic 97.1% |
| Immigrants | Senegal | 0.9 /100 | #250 | Tragic 97.1% |
| South Americans | 0.8 /100 | #251 | Tragic 97.1% |
| Jamaicans | 0.8 /100 | #252 | Tragic 97.1% |
| Immigrants | Liberia | 0.8 /100 | #253 | Tragic 97.1% |
| Immigrants | Middle Africa | 0.8 /100 | #254 | Tragic 97.1% |
| Peruvians | 0.7 /100 | #255 | Tragic 97.1% |
| Bolivians | 0.7 /100 | #256 | Tragic 97.1% |
| Immigrants | Congo | 0.5 /100 | #257 | Tragic 97.0% |
| Immigrants | Colombia | 0.5 /100 | #258 | Tragic 97.0% |
| Immigrants | Ethiopia | 0.4 /100 | #259 | Tragic 97.0% |
| Immigrants | Sierra Leone | 0.4 /100 | #260 | Tragic 97.0% |
| Immigrants | South America | 0.4 /100 | #261 | Tragic 97.0% |
| West Indians | 0.4 /100 | #262 | Tragic 97.0% |
| Immigrants | Jamaica | 0.3 /100 | #263 | Tragic 97.0% |
Demographics Similar to Chileans by 4th Grade
In terms of 4th grade, the demographic groups most similar to Chileans are Kenyan (97.5%, a difference of 0.010%), Immigrants from Poland (97.5%, a difference of 0.010%), Immigrants from Belarus (97.5%, a difference of 0.010%), Immigrants from Spain (97.5%, a difference of 0.010%), and Brazilian (97.5%, a difference of 0.010%).
| Demographics | Rating | Rank | 4th Grade |
| Bermudans | 60.5 /100 | #162 | Good 97.6% |
| Immigrants | Iran | 60.3 /100 | #163 | Good 97.6% |
| Ugandans | 58.9 /100 | #164 | Average 97.6% |
| Venezuelans | 58.7 /100 | #165 | Average 97.6% |
| Kenyans | 56.5 /100 | #166 | Average 97.5% |
| Immigrants | Poland | 55.9 /100 | #167 | Average 97.5% |
| Immigrants | Belarus | 55.8 /100 | #168 | Average 97.5% |
| Chileans | 54.4 /100 | #169 | Average 97.5% |
| Immigrants | Spain | 51.8 /100 | #170 | Average 97.5% |
| Brazilians | 51.5 /100 | #171 | Average 97.5% |
| Immigrants | Sri Lanka | 51.1 /100 | #172 | Average 97.5% |
| Immigrants | Korea | 50.6 /100 | #173 | Average 97.5% |
| Egyptians | 50.0 /100 | #174 | Average 97.5% |
| Immigrants | Micronesia | 49.6 /100 | #175 | Average 97.5% |
| Arabs | 48.7 /100 | #176 | Average 97.5% |