Bolivian vs American Receiving Food Stamps
COMPARE
Bolivian
American
Receiving Food Stamps
Receiving Food Stamps Comparison
Bolivians
Americans
9.3%
RECEIVING FOOD STAMPS
99.7/ 100
METRIC RATING
32nd/ 347
METRIC RANK
12.2%
RECEIVING FOOD STAMPS
26.7/ 100
METRIC RATING
195th/ 347
METRIC RANK
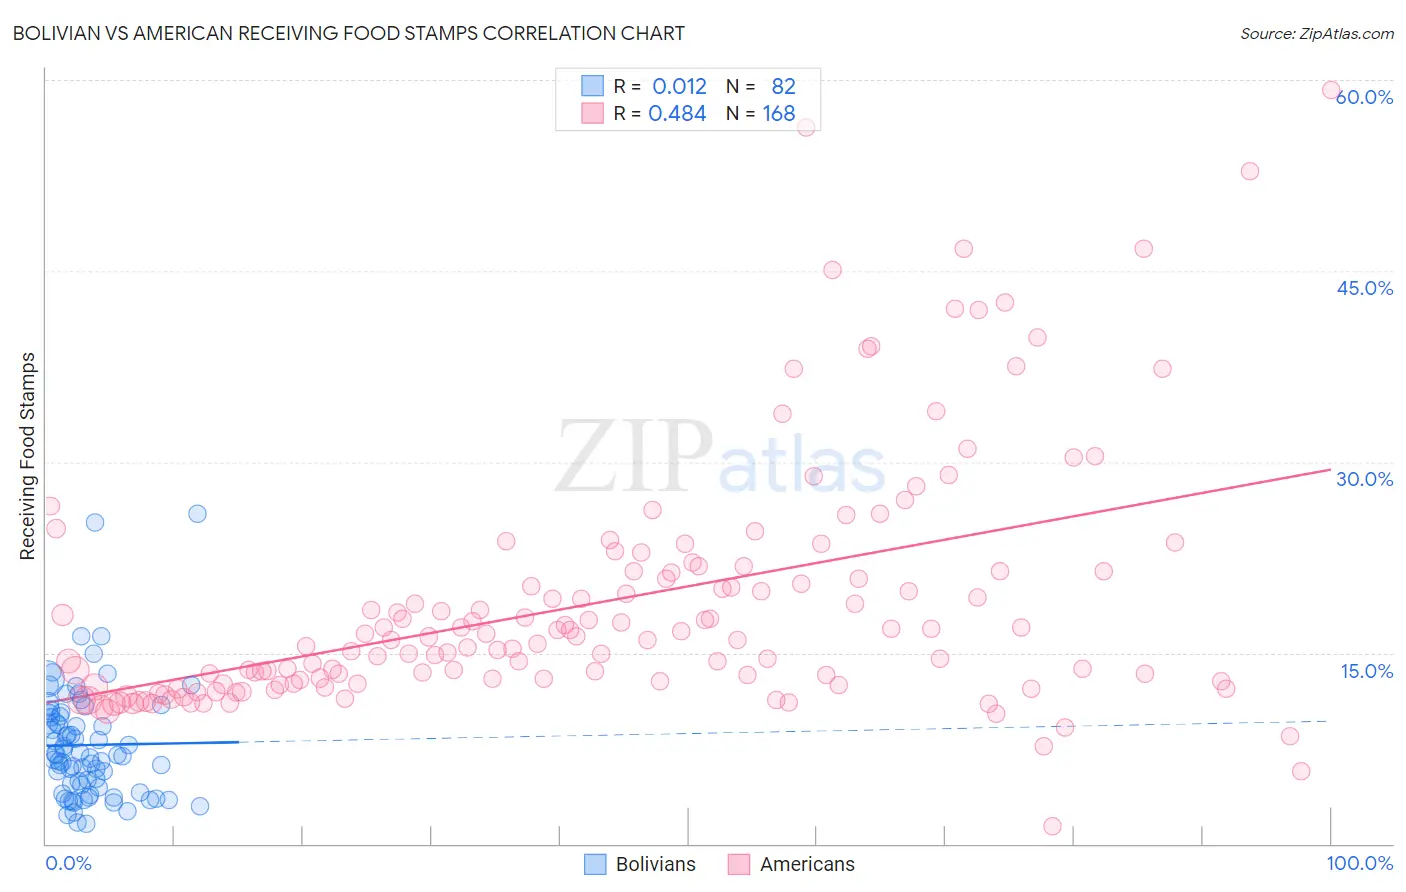
Bolivian vs American Receiving Food Stamps Correlation Chart
The statistical analysis conducted on geographies consisting of 184,439,878 people shows no correlation between the proportion of Bolivians and percentage of population receiving government assistance and/or food stamps in the United States with a correlation coefficient (R) of 0.012 and weighted average of 9.3%. Similarly, the statistical analysis conducted on geographies consisting of 578,010,429 people shows a moderate positive correlation between the proportion of Americans and percentage of population receiving government assistance and/or food stamps in the United States with a correlation coefficient (R) of 0.484 and weighted average of 12.2%, a difference of 30.0%.
Receiving Food Stamps Correlation Summary
| Measurement | Bolivian | American |
| Minimum | 1.6% | 1.4% |
| Maximum | 25.9% | 59.3% |
| Range | 24.3% | 57.9% |
| Mean | 7.8% | 18.9% |
| Median | 7.0% | 16.0% |
| Interquartile 25% (IQ1) | 4.4% | 12.6% |
| Interquartile 75% (IQ3) | 10.0% | 21.4% |
| Interquartile Range (IQR) | 5.6% | 8.8% |
| Standard Deviation (Sample) | 4.5% | 9.8% |
| Standard Deviation (Population) | 4.5% | 9.7% |
Similar Demographics by Receiving Food Stamps
Demographics Similar to Bolivians by Receiving Food Stamps
In terms of receiving food stamps, the demographic groups most similar to Bolivians are Immigrants from Eastern Asia (9.3%, a difference of 0.31%), Immigrants from Sweden (9.3%, a difference of 0.72%), Immigrants from Lithuania (9.2%, a difference of 1.1%), Czech (9.2%, a difference of 1.4%), and Bhutanese (9.2%, a difference of 1.4%).
| Demographics | Rating | Rank | Receiving Food Stamps |
| Immigrants | Ireland | 99.8 /100 | #25 | Exceptional 9.2% |
| Swedes | 99.8 /100 | #26 | Exceptional 9.2% |
| Bhutanese | 99.8 /100 | #27 | Exceptional 9.2% |
| Czechs | 99.8 /100 | #28 | Exceptional 9.2% |
| Immigrants | Lithuania | 99.8 /100 | #29 | Exceptional 9.2% |
| Immigrants | Sweden | 99.7 /100 | #30 | Exceptional 9.3% |
| Immigrants | Eastern Asia | 99.7 /100 | #31 | Exceptional 9.3% |
| Bolivians | 99.7 /100 | #32 | Exceptional 9.3% |
| Zimbabweans | 99.6 /100 | #33 | Exceptional 9.5% |
| Turks | 99.6 /100 | #34 | Exceptional 9.5% |
| Immigrants | Austria | 99.6 /100 | #35 | Exceptional 9.5% |
| Estonians | 99.6 /100 | #36 | Exceptional 9.5% |
| Europeans | 99.6 /100 | #37 | Exceptional 9.5% |
| Immigrants | Sri Lanka | 99.5 /100 | #38 | Exceptional 9.5% |
| Immigrants | Bolivia | 99.5 /100 | #39 | Exceptional 9.5% |
Demographics Similar to Americans by Receiving Food Stamps
In terms of receiving food stamps, the demographic groups most similar to Americans are Iraqi (12.2%, a difference of 0.030%), Immigrants from Sudan (12.1%, a difference of 0.060%), Delaware (12.2%, a difference of 0.11%), Immigrants from Fiji (12.1%, a difference of 0.18%), and Immigrants from Costa Rica (12.2%, a difference of 0.24%).
| Demographics | Rating | Rank | Receiving Food Stamps |
| Sudanese | 33.4 /100 | #188 | Fair 12.0% |
| Immigrants | Cameroon | 32.5 /100 | #189 | Fair 12.0% |
| Immigrants | Peru | 32.2 /100 | #190 | Fair 12.0% |
| Venezuelans | 32.1 /100 | #191 | Fair 12.0% |
| Samoans | 31.0 /100 | #192 | Fair 12.1% |
| Immigrants | Fiji | 27.8 /100 | #193 | Fair 12.1% |
| Immigrants | Sudan | 27.1 /100 | #194 | Fair 12.1% |
| Americans | 26.7 /100 | #195 | Fair 12.2% |
| Iraqis | 26.6 /100 | #196 | Fair 12.2% |
| Delaware | 26.1 /100 | #197 | Fair 12.2% |
| Immigrants | Costa Rica | 25.4 /100 | #198 | Fair 12.2% |
| Portuguese | 25.1 /100 | #199 | Fair 12.2% |
| Sierra Leoneans | 23.6 /100 | #200 | Fair 12.2% |
| Ugandans | 22.5 /100 | #201 | Fair 12.2% |
| Immigrants | Venezuela | 20.1 /100 | #202 | Fair 12.3% |