Bolivian vs Asian Receiving Food Stamps
COMPARE
Bolivian
Asian
Receiving Food Stamps
Receiving Food Stamps Comparison
Bolivians
Asians
9.3%
RECEIVING FOOD STAMPS
99.7/ 100
METRIC RATING
32nd/ 347
METRIC RANK
9.7%
RECEIVING FOOD STAMPS
99.3/ 100
METRIC RATING
51st/ 347
METRIC RANK
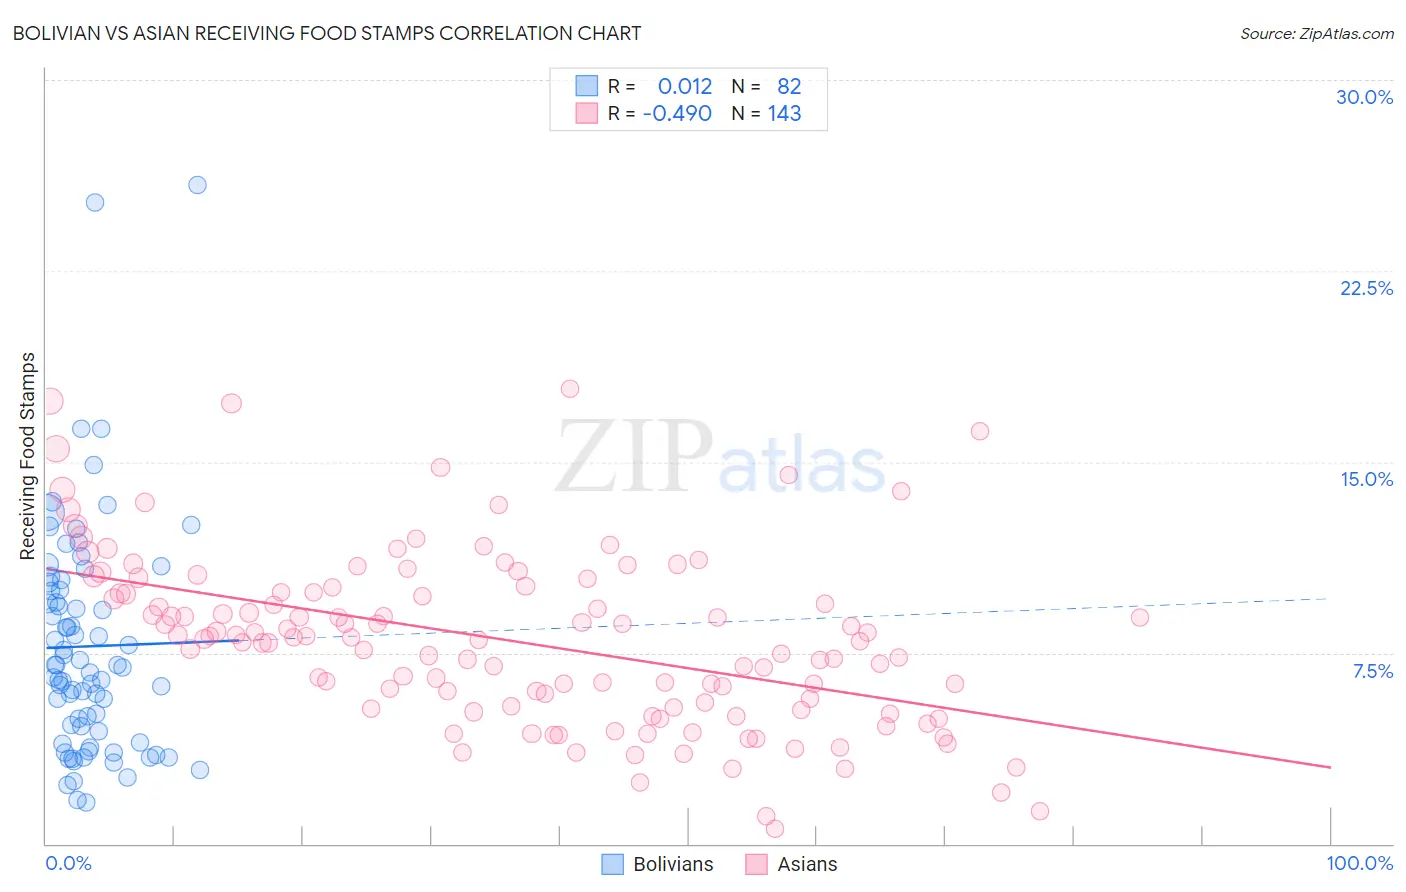
Bolivian vs Asian Receiving Food Stamps Correlation Chart
The statistical analysis conducted on geographies consisting of 184,439,878 people shows no correlation between the proportion of Bolivians and percentage of population receiving government assistance and/or food stamps in the United States with a correlation coefficient (R) of 0.012 and weighted average of 9.3%. Similarly, the statistical analysis conducted on geographies consisting of 547,774,062 people shows a moderate negative correlation between the proportion of Asians and percentage of population receiving government assistance and/or food stamps in the United States with a correlation coefficient (R) of -0.490 and weighted average of 9.7%, a difference of 3.6%.
Receiving Food Stamps Correlation Summary
| Measurement | Bolivian | Asian |
| Minimum | 1.6% | 0.60% |
| Maximum | 25.9% | 17.9% |
| Range | 24.3% | 17.3% |
| Mean | 7.8% | 8.0% |
| Median | 7.0% | 8.0% |
| Interquartile 25% (IQ1) | 4.4% | 5.3% |
| Interquartile 75% (IQ3) | 10.0% | 9.9% |
| Interquartile Range (IQR) | 5.6% | 4.6% |
| Standard Deviation (Sample) | 4.5% | 3.4% |
| Standard Deviation (Population) | 4.5% | 3.4% |
Demographics Similar to Bolivians and Asians by Receiving Food Stamps
In terms of receiving food stamps, the demographic groups most similar to Bolivians are Immigrants from Eastern Asia (9.3%, a difference of 0.31%), Zimbabwean (9.5%, a difference of 1.5%), Turkish (9.5%, a difference of 1.5%), Immigrants from Austria (9.5%, a difference of 1.5%), and Estonian (9.5%, a difference of 1.5%). Similarly, the demographic groups most similar to Asians are Lithuanian (9.7%, a difference of 0.18%), Immigrants from Czechoslovakia (9.6%, a difference of 0.43%), Russian (9.6%, a difference of 0.45%), Indian (Asian) (9.6%, a difference of 0.56%), and Australian (9.6%, a difference of 0.62%).
| Demographics | Rating | Rank | Receiving Food Stamps |
| Immigrants | Eastern Asia | 99.7 /100 | #31 | Exceptional 9.3% |
| Bolivians | 99.7 /100 | #32 | Exceptional 9.3% |
| Zimbabweans | 99.6 /100 | #33 | Exceptional 9.5% |
| Turks | 99.6 /100 | #34 | Exceptional 9.5% |
| Immigrants | Austria | 99.6 /100 | #35 | Exceptional 9.5% |
| Estonians | 99.6 /100 | #36 | Exceptional 9.5% |
| Europeans | 99.6 /100 | #37 | Exceptional 9.5% |
| Immigrants | Sri Lanka | 99.5 /100 | #38 | Exceptional 9.5% |
| Immigrants | Bolivia | 99.5 /100 | #39 | Exceptional 9.5% |
| Immigrants | Netherlands | 99.5 /100 | #40 | Exceptional 9.5% |
| Cambodians | 99.5 /100 | #41 | Exceptional 9.5% |
| Immigrants | China | 99.5 /100 | #42 | Exceptional 9.6% |
| Croatians | 99.5 /100 | #43 | Exceptional 9.6% |
| Immigrants | Denmark | 99.4 /100 | #44 | Exceptional 9.6% |
| Immigrants | Belgium | 99.4 /100 | #45 | Exceptional 9.6% |
| Australians | 99.4 /100 | #46 | Exceptional 9.6% |
| Indians (Asian) | 99.4 /100 | #47 | Exceptional 9.6% |
| Russians | 99.4 /100 | #48 | Exceptional 9.6% |
| Immigrants | Czechoslovakia | 99.4 /100 | #49 | Exceptional 9.6% |
| Lithuanians | 99.4 /100 | #50 | Exceptional 9.7% |
| Asians | 99.3 /100 | #51 | Exceptional 9.7% |