Bolivian vs Asian Unemployment
COMPARE
Bolivian
Asian
Unemployment
Unemployment Comparison
Bolivians
Asians
4.8%
UNEMPLOYMENT
99.7/ 100
METRIC RATING
38th/ 347
METRIC RANK
5.1%
UNEMPLOYMENT
89.0/ 100
METRIC RATING
123rd/ 347
METRIC RANK
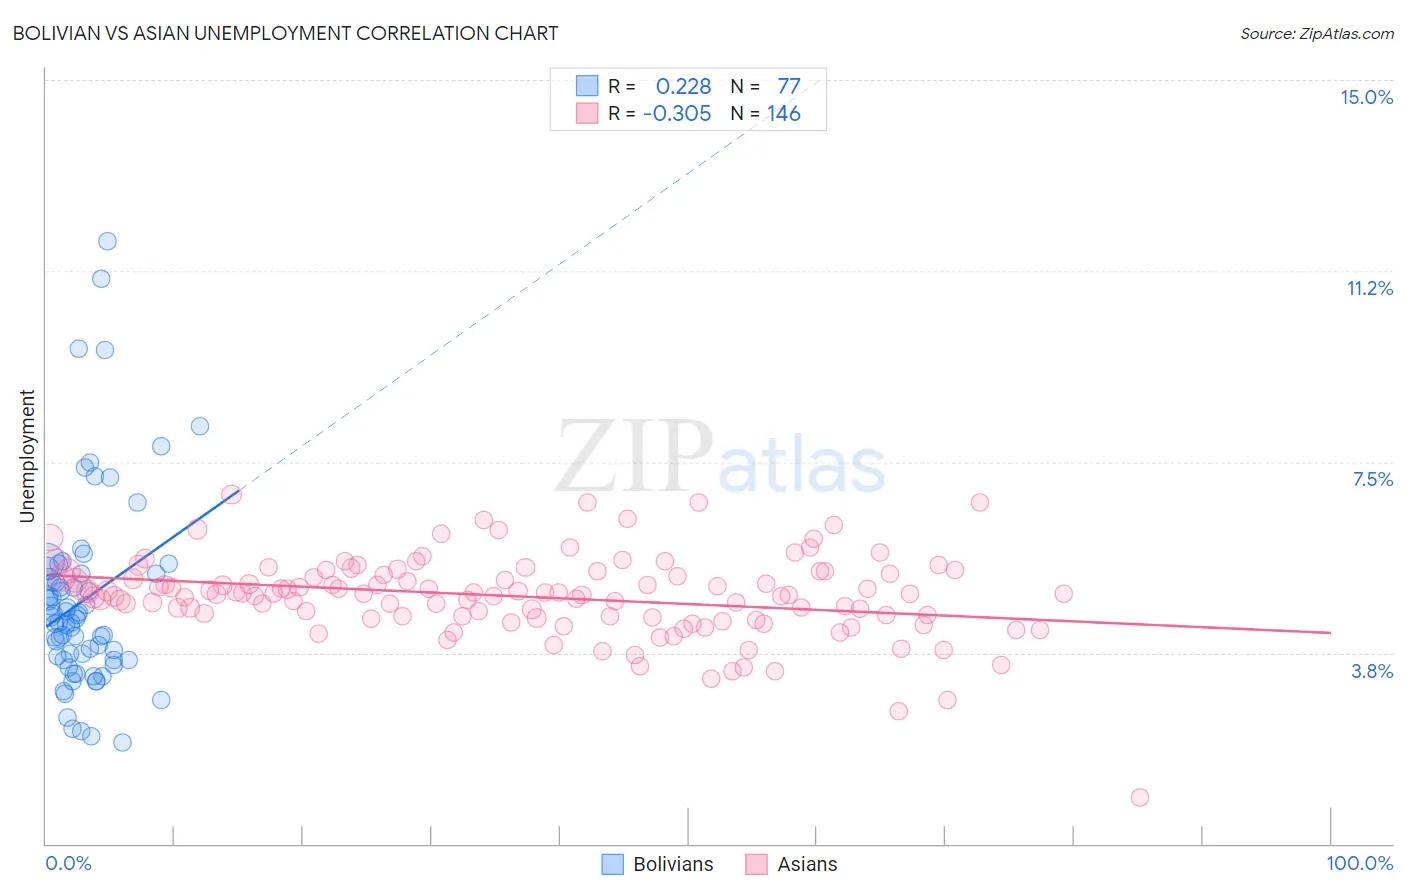
Bolivian vs Asian Unemployment Correlation Chart
The statistical analysis conducted on geographies consisting of 184,629,958 people shows a weak positive correlation between the proportion of Bolivians and unemployment in the United States with a correlation coefficient (R) of 0.228 and weighted average of 4.8%. Similarly, the statistical analysis conducted on geographies consisting of 548,726,381 people shows a mild negative correlation between the proportion of Asians and unemployment in the United States with a correlation coefficient (R) of -0.305 and weighted average of 5.1%, a difference of 6.2%.
Unemployment Correlation Summary
| Measurement | Bolivian | Asian |
| Minimum | 2.0% | 0.90% |
| Maximum | 11.8% | 6.9% |
| Range | 9.8% | 6.0% |
| Mean | 4.8% | 4.9% |
| Median | 4.4% | 4.9% |
| Interquartile 25% (IQ1) | 3.6% | 4.5% |
| Interquartile 75% (IQ3) | 5.3% | 5.3% |
| Interquartile Range (IQR) | 1.7% | 0.84% |
| Standard Deviation (Sample) | 1.9% | 0.81% |
| Standard Deviation (Population) | 1.9% | 0.81% |
Similar Demographics by Unemployment
Demographics Similar to Bolivians by Unemployment
In terms of unemployment, the demographic groups most similar to Bolivians are Lithuanian (4.8%, a difference of 0.14%), Northern European (4.8%, a difference of 0.16%), Czechoslovakian (4.8%, a difference of 0.19%), Immigrants from Bosnia and Herzegovina (4.8%, a difference of 0.19%), and Tongan (4.8%, a difference of 0.26%).
| Demographics | Rating | Rank | Unemployment |
| Croatians | 99.8 /100 | #31 | Exceptional 4.8% |
| Zimbabweans | 99.8 /100 | #32 | Exceptional 4.8% |
| Sudanese | 99.8 /100 | #33 | Exceptional 4.8% |
| Immigrants | Bolivia | 99.8 /100 | #34 | Exceptional 4.8% |
| Scotch-Irish | 99.8 /100 | #35 | Exceptional 4.8% |
| Tongans | 99.7 /100 | #36 | Exceptional 4.8% |
| Czechoslovakians | 99.7 /100 | #37 | Exceptional 4.8% |
| Bolivians | 99.7 /100 | #38 | Exceptional 4.8% |
| Lithuanians | 99.7 /100 | #39 | Exceptional 4.8% |
| Northern Europeans | 99.7 /100 | #40 | Exceptional 4.8% |
| Immigrants | Bosnia and Herzegovina | 99.7 /100 | #41 | Exceptional 4.8% |
| Filipinos | 99.5 /100 | #42 | Exceptional 4.8% |
| Yugoslavians | 99.5 /100 | #43 | Exceptional 4.8% |
| Austrians | 99.5 /100 | #44 | Exceptional 4.8% |
| French | 99.5 /100 | #45 | Exceptional 4.8% |
Demographics Similar to Asians by Unemployment
In terms of unemployment, the demographic groups most similar to Asians are Immigrants from Switzerland (5.1%, a difference of 0.020%), Lebanese (5.1%, a difference of 0.040%), Ethiopian (5.1%, a difference of 0.050%), Immigrants from Eastern Asia (5.1%, a difference of 0.10%), and Macedonian (5.1%, a difference of 0.11%).
| Demographics | Rating | Rank | Unemployment |
| Immigrants | Sri Lanka | 91.1 /100 | #116 | Exceptional 5.1% |
| Immigrants | Malaysia | 91.0 /100 | #117 | Exceptional 5.1% |
| Immigrants | Germany | 90.8 /100 | #118 | Exceptional 5.1% |
| Immigrants | France | 89.7 /100 | #119 | Excellent 5.1% |
| Macedonians | 89.7 /100 | #120 | Excellent 5.1% |
| Lebanese | 89.2 /100 | #121 | Excellent 5.1% |
| Immigrants | Switzerland | 89.1 /100 | #122 | Excellent 5.1% |
| Asians | 89.0 /100 | #123 | Excellent 5.1% |
| Ethiopians | 88.6 /100 | #124 | Excellent 5.1% |
| Immigrants | Eastern Asia | 88.3 /100 | #125 | Excellent 5.1% |
| Kenyans | 88.2 /100 | #126 | Excellent 5.1% |
| Immigrants | Kenya | 88.2 /100 | #127 | Excellent 5.1% |
| Immigrants | Eastern Africa | 88.1 /100 | #128 | Excellent 5.1% |
| Immigrants | Latvia | 88.0 /100 | #129 | Excellent 5.1% |
| Iranians | 86.9 /100 | #130 | Excellent 5.1% |