Bolivian vs Asian Child Poverty Under the Age of 16
COMPARE
Bolivian
Asian
Child Poverty Under the Age of 16
Child Poverty Under the Age of 16 Comparison
Bolivians
Asians
13.2%
CHILD POVERTY UNDER THE AGE OF 16
99.8/ 100
METRIC RATING
26th/ 347
METRIC RANK
13.5%
CHILD POVERTY UNDER THE AGE OF 16
99.6/ 100
METRIC RATING
33rd/ 347
METRIC RANK
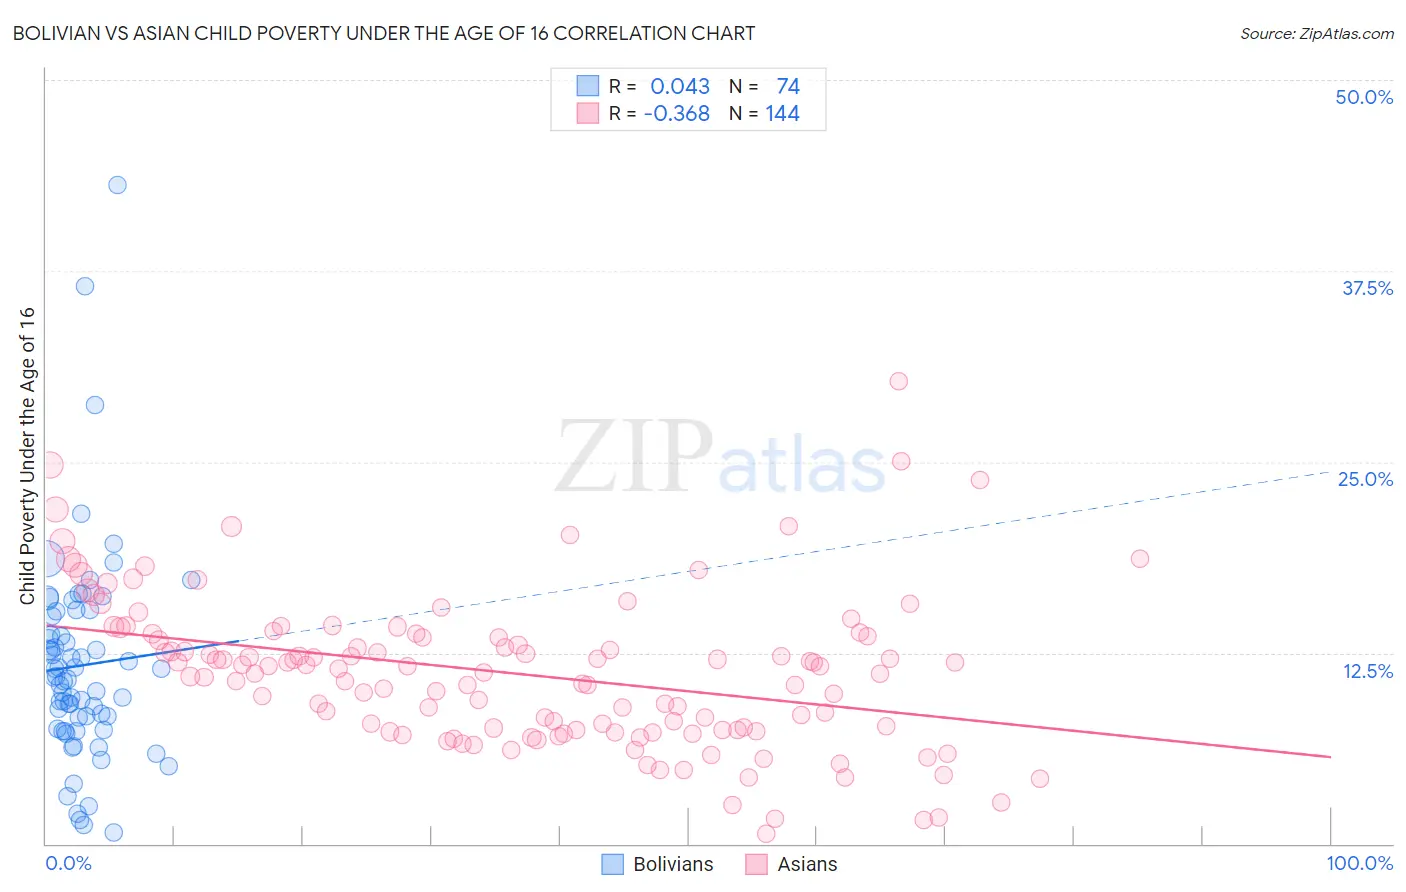
Bolivian vs Asian Child Poverty Under the Age of 16 Correlation Chart
The statistical analysis conducted on geographies consisting of 184,043,367 people shows no correlation between the proportion of Bolivians and poverty level among children under the age of 16 in the United States with a correlation coefficient (R) of 0.043 and weighted average of 13.2%. Similarly, the statistical analysis conducted on geographies consisting of 540,573,654 people shows a mild negative correlation between the proportion of Asians and poverty level among children under the age of 16 in the United States with a correlation coefficient (R) of -0.368 and weighted average of 13.5%, a difference of 1.7%.
Child Poverty Under the Age of 16 Correlation Summary
| Measurement | Bolivian | Asian |
| Minimum | 0.74% | 0.65% |
| Maximum | 43.1% | 30.3% |
| Range | 42.4% | 29.6% |
| Mean | 11.7% | 11.2% |
| Median | 10.8% | 11.3% |
| Interquartile 25% (IQ1) | 7.6% | 7.4% |
| Interquartile 75% (IQ3) | 14.9% | 13.7% |
| Interquartile Range (IQR) | 7.3% | 6.2% |
| Standard Deviation (Sample) | 6.9% | 5.0% |
| Standard Deviation (Population) | 6.8% | 5.0% |
Demographics Similar to Bolivians and Asians by Child Poverty Under the Age of 16
In terms of child poverty under the age of 16, the demographic groups most similar to Bolivians are Immigrants from China (13.3%, a difference of 0.29%), Eastern European (13.2%, a difference of 0.42%), Latvian (13.2%, a difference of 0.50%), Assyrian/Chaldean/Syriac (13.3%, a difference of 0.53%), and Indian (Asian) (13.1%, a difference of 0.71%). Similarly, the demographic groups most similar to Asians are Russian (13.5%, a difference of 0.28%), Lithuanian (13.5%, a difference of 0.48%), Tongan (13.4%, a difference of 0.49%), Danish (13.4%, a difference of 0.50%), and Turkish (13.4%, a difference of 0.71%).
| Demographics | Rating | Rank | Child Poverty Under the Age of 16 |
| Immigrants | Japan | 99.8 /100 | #19 | Exceptional 13.0% |
| Okinawans | 99.8 /100 | #20 | Exceptional 13.1% |
| Immigrants | Eastern Asia | 99.8 /100 | #21 | Exceptional 13.1% |
| Maltese | 99.8 /100 | #22 | Exceptional 13.1% |
| Indians (Asian) | 99.8 /100 | #23 | Exceptional 13.1% |
| Latvians | 99.8 /100 | #24 | Exceptional 13.2% |
| Eastern Europeans | 99.8 /100 | #25 | Exceptional 13.2% |
| Bolivians | 99.8 /100 | #26 | Exceptional 13.2% |
| Immigrants | China | 99.8 /100 | #27 | Exceptional 13.3% |
| Assyrians/Chaldeans/Syriacs | 99.7 /100 | #28 | Exceptional 13.3% |
| Swedes | 99.7 /100 | #29 | Exceptional 13.3% |
| Turks | 99.7 /100 | #30 | Exceptional 13.4% |
| Danes | 99.7 /100 | #31 | Exceptional 13.4% |
| Tongans | 99.7 /100 | #32 | Exceptional 13.4% |
| Asians | 99.6 /100 | #33 | Exceptional 13.5% |
| Russians | 99.6 /100 | #34 | Exceptional 13.5% |
| Lithuanians | 99.6 /100 | #35 | Exceptional 13.5% |
| Immigrants | Northern Europe | 99.6 /100 | #36 | Exceptional 13.6% |
| Immigrants | Bolivia | 99.6 /100 | #37 | Exceptional 13.6% |
| Luxembourgers | 99.5 /100 | #38 | Exceptional 13.6% |
| Immigrants | Australia | 99.5 /100 | #39 | Exceptional 13.6% |