Slavic vs Immigrants from Zimbabwe Child Poverty Among Girls Under 16
COMPARE
Slavic
Immigrants from Zimbabwe
Child Poverty Among Girls Under 16
Child Poverty Among Girls Under 16 Comparison
Slavs
Immigrants from Zimbabwe
15.7%
CHILD POVERTY AMONG GIRLS UNDER 16
83.1/ 100
METRIC RATING
147th/ 347
METRIC RANK
15.3%
CHILD POVERTY AMONG GIRLS UNDER 16
92.5/ 100
METRIC RATING
119th/ 347
METRIC RANK
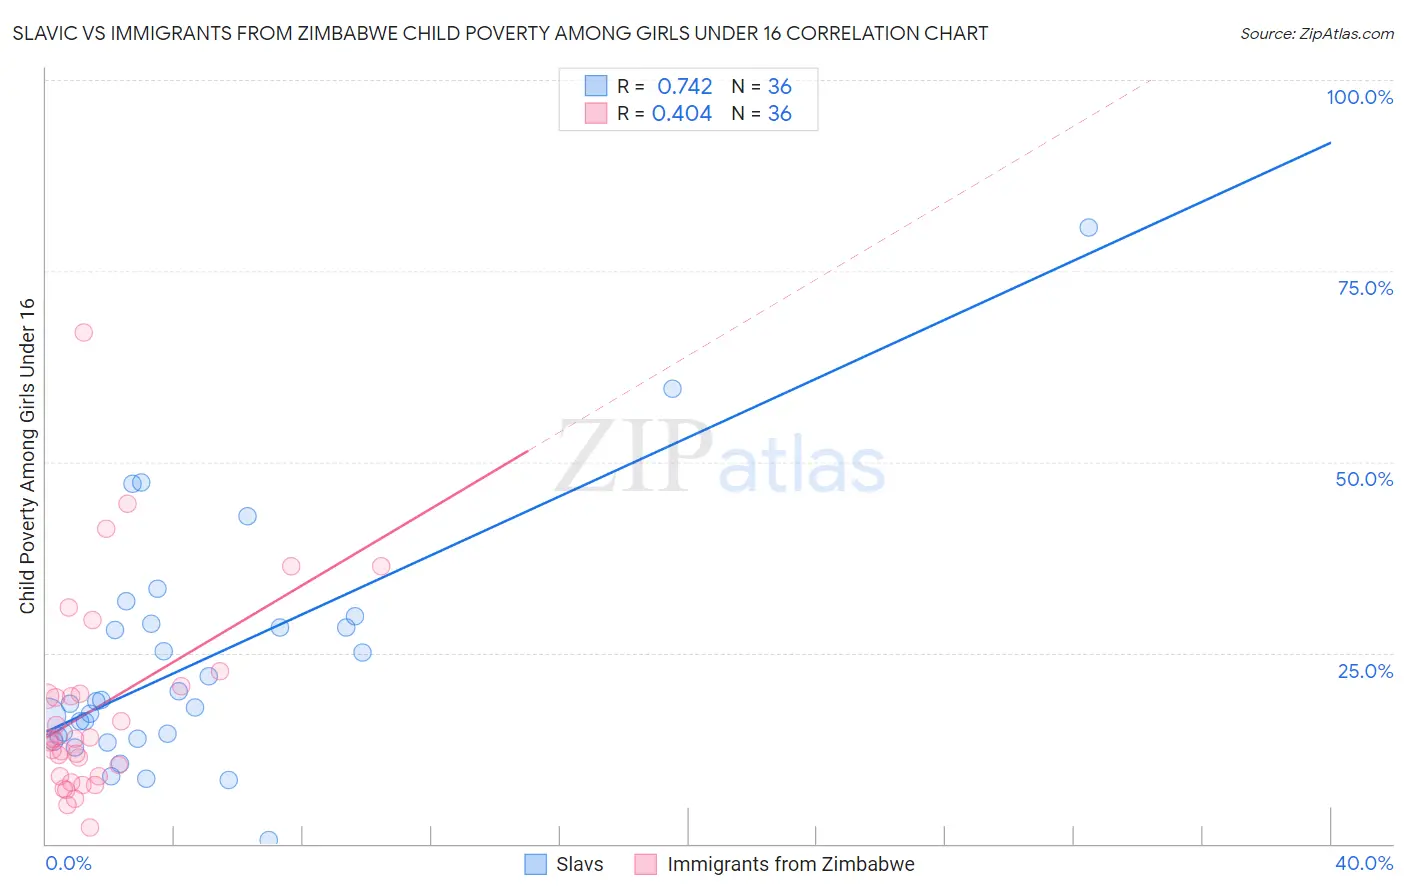
Slavic vs Immigrants from Zimbabwe Child Poverty Among Girls Under 16 Correlation Chart
The statistical analysis conducted on geographies consisting of 266,780,772 people shows a strong positive correlation between the proportion of Slavs and poverty level among girls under the age of 16 in the United States with a correlation coefficient (R) of 0.742 and weighted average of 15.7%. Similarly, the statistical analysis conducted on geographies consisting of 117,219,082 people shows a moderate positive correlation between the proportion of Immigrants from Zimbabwe and poverty level among girls under the age of 16 in the United States with a correlation coefficient (R) of 0.404 and weighted average of 15.3%, a difference of 2.8%.
Child Poverty Among Girls Under 16 Correlation Summary
| Measurement | Slavic | Immigrants from Zimbabwe |
| Minimum | 0.51% | 2.0% |
| Maximum | 80.7% | 67.0% |
| Range | 80.2% | 64.9% |
| Mean | 23.6% | 17.9% |
| Median | 18.5% | 13.8% |
| Interquartile 25% (IQ1) | 14.0% | 8.8% |
| Interquartile 75% (IQ3) | 28.6% | 20.1% |
| Interquartile Range (IQR) | 14.6% | 11.3% |
| Standard Deviation (Sample) | 15.8% | 13.4% |
| Standard Deviation (Population) | 15.6% | 13.2% |
Similar Demographics by Child Poverty Among Girls Under 16
Demographics Similar to Slavs by Child Poverty Among Girls Under 16
In terms of child poverty among girls under 16, the demographic groups most similar to Slavs are Icelander (15.7%, a difference of 0.15%), Samoan (15.7%, a difference of 0.23%), Immigrants from Hungary (15.8%, a difference of 0.46%), Immigrants from Albania (15.8%, a difference of 0.50%), and Welsh (15.6%, a difference of 0.53%).
| Demographics | Rating | Rank | Child Poverty Among Girls Under 16 |
| New Zealanders | 87.2 /100 | #140 | Excellent 15.6% |
| Immigrants | Jordan | 87.2 /100 | #141 | Excellent 15.6% |
| Canadians | 87.1 /100 | #142 | Excellent 15.6% |
| Immigrants | Peru | 86.6 /100 | #143 | Excellent 15.6% |
| Israelis | 86.3 /100 | #144 | Excellent 15.6% |
| Welsh | 85.4 /100 | #145 | Excellent 15.6% |
| Samoans | 84.2 /100 | #146 | Excellent 15.7% |
| Slavs | 83.1 /100 | #147 | Excellent 15.7% |
| Icelanders | 82.4 /100 | #148 | Excellent 15.7% |
| Immigrants | Hungary | 80.9 /100 | #149 | Excellent 15.8% |
| Immigrants | Albania | 80.7 /100 | #150 | Excellent 15.8% |
| Venezuelans | 80.1 /100 | #151 | Excellent 15.8% |
| Immigrants | Kuwait | 79.4 /100 | #152 | Good 15.8% |
| Immigrants | Nepal | 78.5 /100 | #153 | Good 15.9% |
| Immigrants | Chile | 76.7 /100 | #154 | Good 15.9% |
Demographics Similar to Immigrants from Zimbabwe by Child Poverty Among Girls Under 16
In terms of child poverty among girls under 16, the demographic groups most similar to Immigrants from Zimbabwe are Pakistani (15.3%, a difference of 0.090%), Immigrants from Southern Europe (15.3%, a difference of 0.11%), English (15.3%, a difference of 0.11%), Immigrants from North Macedonia (15.2%, a difference of 0.29%), and Portuguese (15.3%, a difference of 0.30%).
| Demographics | Rating | Rank | Child Poverty Among Girls Under 16 |
| Immigrants | Kazakhstan | 94.3 /100 | #112 | Exceptional 15.1% |
| Dutch | 94.3 /100 | #113 | Exceptional 15.1% |
| Sri Lankans | 94.0 /100 | #114 | Exceptional 15.2% |
| Belgians | 93.9 /100 | #115 | Exceptional 15.2% |
| Immigrants | Denmark | 93.3 /100 | #116 | Exceptional 15.2% |
| Immigrants | North Macedonia | 93.1 /100 | #117 | Exceptional 15.2% |
| Immigrants | Southern Europe | 92.7 /100 | #118 | Exceptional 15.3% |
| Immigrants | Zimbabwe | 92.5 /100 | #119 | Exceptional 15.3% |
| Pakistanis | 92.3 /100 | #120 | Exceptional 15.3% |
| English | 92.2 /100 | #121 | Exceptional 15.3% |
| Portuguese | 91.8 /100 | #122 | Exceptional 15.3% |
| Irish | 91.5 /100 | #123 | Exceptional 15.3% |
| Carpatho Rusyns | 91.4 /100 | #124 | Exceptional 15.3% |
| Peruvians | 91.2 /100 | #125 | Exceptional 15.4% |
| Scottish | 91.0 /100 | #126 | Exceptional 15.4% |