Black/African American vs Immigrants from Germany Child Poverty Under the Age of 16
COMPARE
Black/African American
Immigrants from Germany
Child Poverty Under the Age of 16
Child Poverty Under the Age of 16 Comparison
Blacks/African Americans
Immigrants from Germany
24.4%
CHILD POVERTY UNDER THE AGE OF 16
0.0/ 100
METRIC RATING
334th/ 347
METRIC RANK
15.8%
CHILD POVERTY UNDER THE AGE OF 16
67.3/ 100
METRIC RATING
164th/ 347
METRIC RANK
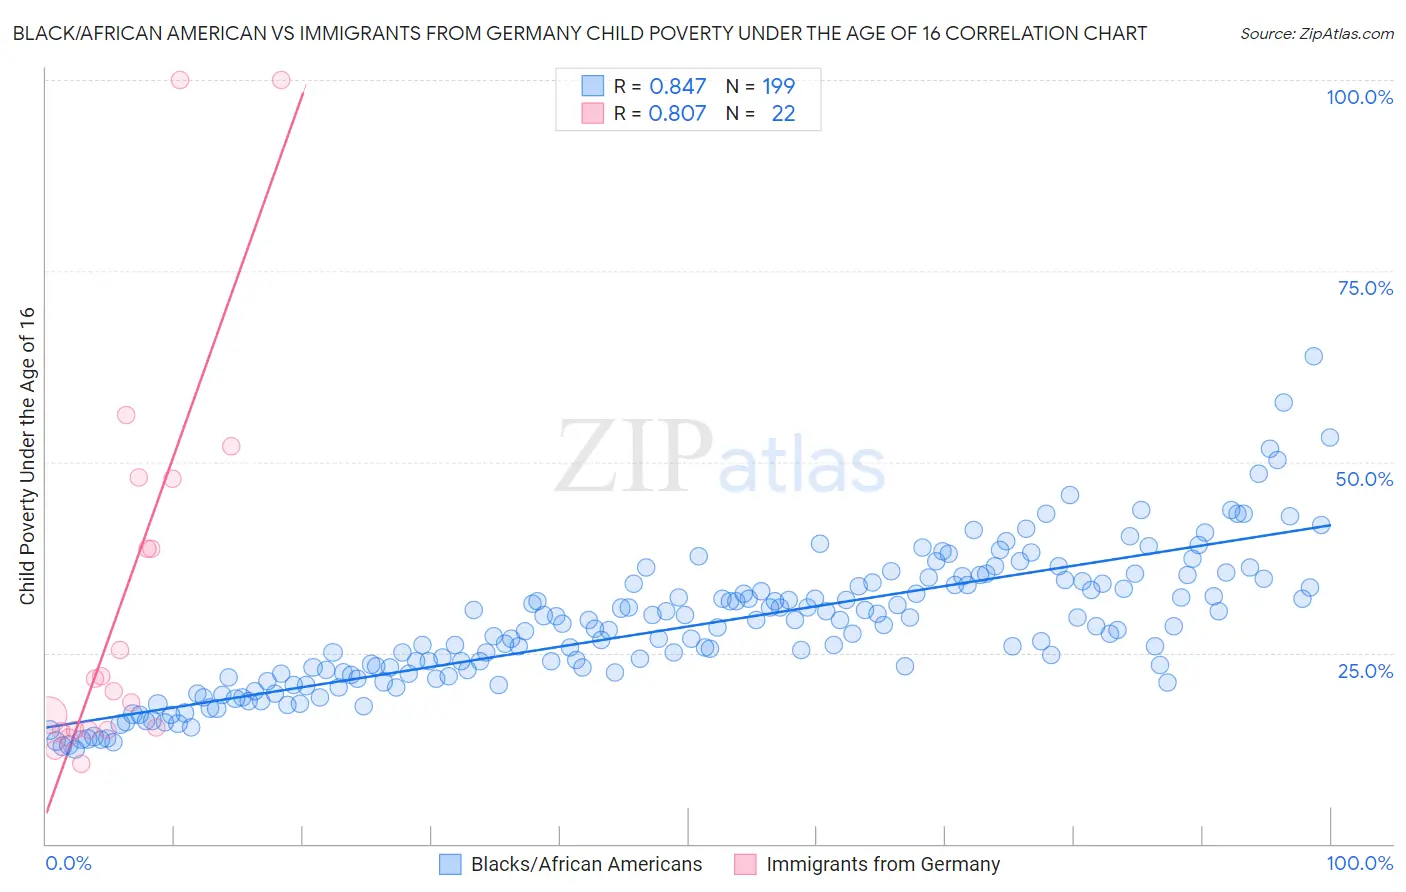
Black/African American vs Immigrants from Germany Child Poverty Under the Age of 16 Correlation Chart
The statistical analysis conducted on geographies consisting of 555,331,185 people shows a very strong positive correlation between the proportion of Blacks/African Americans and poverty level among children under the age of 16 in the United States with a correlation coefficient (R) of 0.847 and weighted average of 24.4%. Similarly, the statistical analysis conducted on geographies consisting of 458,231,020 people shows a very strong positive correlation between the proportion of Immigrants from Germany and poverty level among children under the age of 16 in the United States with a correlation coefficient (R) of 0.807 and weighted average of 15.8%, a difference of 54.2%.
Child Poverty Under the Age of 16 Correlation Summary
| Measurement | Black/African American | Immigrants from Germany |
| Minimum | 12.3% | 10.5% |
| Maximum | 63.9% | 100.0% |
| Range | 51.6% | 89.5% |
| Mean | 28.4% | 32.6% |
| Median | 28.1% | 20.8% |
| Interquartile 25% (IQ1) | 22.0% | 14.9% |
| Interquartile 75% (IQ3) | 33.9% | 47.8% |
| Interquartile Range (IQR) | 11.9% | 32.9% |
| Standard Deviation (Sample) | 9.0% | 26.1% |
| Standard Deviation (Population) | 9.0% | 25.5% |
Similar Demographics by Child Poverty Under the Age of 16
Demographics Similar to Blacks/African Americans by Child Poverty Under the Age of 16
In terms of child poverty under the age of 16, the demographic groups most similar to Blacks/African Americans are Houma (24.9%, a difference of 1.7%), Immigrants from Dominican Republic (24.0%, a difference of 2.0%), Pueblo (23.9%, a difference of 2.1%), Apache (23.8%, a difference of 2.5%), and Native/Alaskan (23.8%, a difference of 2.8%).
| Demographics | Rating | Rank | Child Poverty Under the Age of 16 |
| Menominee | 0.0 /100 | #327 | Tragic 23.0% |
| Colville | 0.0 /100 | #328 | Tragic 23.0% |
| Dominicans | 0.0 /100 | #329 | Tragic 23.8% |
| Natives/Alaskans | 0.0 /100 | #330 | Tragic 23.8% |
| Apache | 0.0 /100 | #331 | Tragic 23.8% |
| Pueblo | 0.0 /100 | #332 | Tragic 23.9% |
| Immigrants | Dominican Republic | 0.0 /100 | #333 | Tragic 24.0% |
| Blacks/African Americans | 0.0 /100 | #334 | Tragic 24.4% |
| Houma | 0.0 /100 | #335 | Tragic 24.9% |
| Yup'ik | 0.0 /100 | #336 | Tragic 25.1% |
| Sioux | 0.0 /100 | #337 | Tragic 25.2% |
| Cheyenne | 0.0 /100 | #338 | Tragic 25.4% |
| Crow | 0.0 /100 | #339 | Tragic 26.0% |
| Hopi | 0.0 /100 | #340 | Tragic 27.1% |
| Yuman | 0.0 /100 | #341 | Tragic 28.9% |
Demographics Similar to Immigrants from Germany by Child Poverty Under the Age of 16
In terms of child poverty under the age of 16, the demographic groups most similar to Immigrants from Germany are Colombian (15.8%, a difference of 0.040%), Yugoslavian (15.8%, a difference of 0.040%), Immigrants from Northern Africa (15.8%, a difference of 0.10%), Guamanian/Chamorro (15.9%, a difference of 0.13%), and Immigrants from Oceania (15.9%, a difference of 0.27%).
| Demographics | Rating | Rank | Child Poverty Under the Age of 16 |
| Immigrants | Nepal | 72.9 /100 | #157 | Good 15.7% |
| Immigrants | Chile | 72.8 /100 | #158 | Good 15.7% |
| Immigrants | Fiji | 71.1 /100 | #159 | Good 15.8% |
| Immigrants | Albania | 70.7 /100 | #160 | Good 15.8% |
| Immigrants | Northern Africa | 68.1 /100 | #161 | Good 15.8% |
| Colombians | 67.6 /100 | #162 | Good 15.8% |
| Yugoslavians | 67.6 /100 | #163 | Good 15.8% |
| Immigrants | Germany | 67.3 /100 | #164 | Good 15.8% |
| Guamanians/Chamorros | 66.4 /100 | #165 | Good 15.9% |
| Immigrants | Oceania | 65.4 /100 | #166 | Good 15.9% |
| Costa Ricans | 61.1 /100 | #167 | Good 16.0% |
| South Americans | 57.9 /100 | #168 | Average 16.0% |
| Uruguayans | 54.7 /100 | #169 | Average 16.1% |
| Immigrants | Colombia | 54.4 /100 | #170 | Average 16.1% |
| Hungarians | 52.5 /100 | #171 | Average 16.2% |