Serbian vs Immigrants from Germany Child Poverty Under the Age of 16
COMPARE
Serbian
Immigrants from Germany
Child Poverty Under the Age of 16
Child Poverty Under the Age of 16 Comparison
Serbians
Immigrants from Germany
14.8%
CHILD POVERTY UNDER THE AGE OF 16
94.5/ 100
METRIC RATING
106th/ 347
METRIC RANK
15.8%
CHILD POVERTY UNDER THE AGE OF 16
67.3/ 100
METRIC RATING
164th/ 347
METRIC RANK
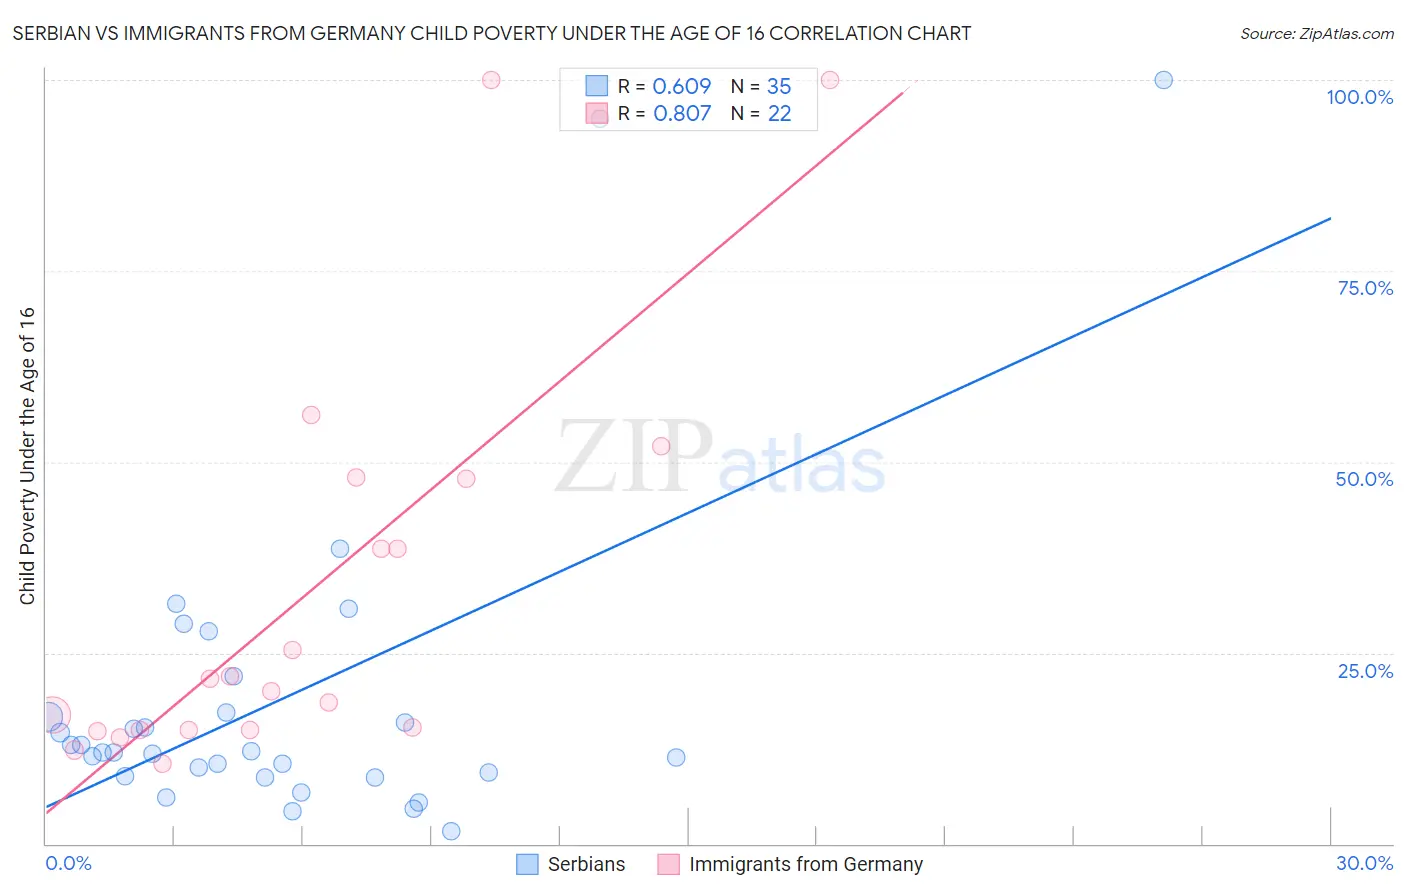
Serbian vs Immigrants from Germany Child Poverty Under the Age of 16 Correlation Chart
The statistical analysis conducted on geographies consisting of 265,642,199 people shows a significant positive correlation between the proportion of Serbians and poverty level among children under the age of 16 in the United States with a correlation coefficient (R) of 0.609 and weighted average of 14.8%. Similarly, the statistical analysis conducted on geographies consisting of 458,231,020 people shows a very strong positive correlation between the proportion of Immigrants from Germany and poverty level among children under the age of 16 in the United States with a correlation coefficient (R) of 0.807 and weighted average of 15.8%, a difference of 6.9%.
Child Poverty Under the Age of 16 Correlation Summary
| Measurement | Serbian | Immigrants from Germany |
| Minimum | 1.6% | 10.5% |
| Maximum | 100.0% | 100.0% |
| Range | 98.4% | 89.5% |
| Mean | 18.9% | 32.6% |
| Median | 12.0% | 20.8% |
| Interquartile 25% (IQ1) | 8.9% | 14.9% |
| Interquartile 75% (IQ3) | 17.2% | 47.8% |
| Interquartile Range (IQR) | 8.4% | 32.9% |
| Standard Deviation (Sample) | 21.4% | 26.1% |
| Standard Deviation (Population) | 21.1% | 25.5% |
Similar Demographics by Child Poverty Under the Age of 16
Demographics Similar to Serbians by Child Poverty Under the Age of 16
In terms of child poverty under the age of 16, the demographic groups most similar to Serbians are Chilean (14.8%, a difference of 0.060%), Basque (14.8%, a difference of 0.13%), Jordanian (14.8%, a difference of 0.15%), Tlingit-Haida (14.9%, a difference of 0.22%), and Immigrants from England (14.8%, a difference of 0.24%).
| Demographics | Rating | Rank | Child Poverty Under the Age of 16 |
| British | 95.5 /100 | #99 | Exceptional 14.7% |
| Dutch | 95.1 /100 | #100 | Exceptional 14.8% |
| Immigrants | Switzerland | 95.1 /100 | #101 | Exceptional 14.8% |
| Romanians | 95.0 /100 | #102 | Exceptional 14.8% |
| Immigrants | Egypt | 94.9 /100 | #103 | Exceptional 14.8% |
| Immigrants | England | 94.8 /100 | #104 | Exceptional 14.8% |
| Basques | 94.7 /100 | #105 | Exceptional 14.8% |
| Serbians | 94.5 /100 | #106 | Exceptional 14.8% |
| Chileans | 94.4 /100 | #107 | Exceptional 14.8% |
| Jordanians | 94.2 /100 | #108 | Exceptional 14.8% |
| Tlingit-Haida | 94.1 /100 | #109 | Exceptional 14.9% |
| English | 93.5 /100 | #110 | Exceptional 14.9% |
| Immigrants | Denmark | 93.5 /100 | #111 | Exceptional 14.9% |
| Irish | 93.4 /100 | #112 | Exceptional 14.9% |
| Belgians | 93.3 /100 | #113 | Exceptional 14.9% |
Demographics Similar to Immigrants from Germany by Child Poverty Under the Age of 16
In terms of child poverty under the age of 16, the demographic groups most similar to Immigrants from Germany are Colombian (15.8%, a difference of 0.040%), Yugoslavian (15.8%, a difference of 0.040%), Immigrants from Northern Africa (15.8%, a difference of 0.10%), Guamanian/Chamorro (15.9%, a difference of 0.13%), and Immigrants from Oceania (15.9%, a difference of 0.27%).
| Demographics | Rating | Rank | Child Poverty Under the Age of 16 |
| Immigrants | Nepal | 72.9 /100 | #157 | Good 15.7% |
| Immigrants | Chile | 72.8 /100 | #158 | Good 15.7% |
| Immigrants | Fiji | 71.1 /100 | #159 | Good 15.8% |
| Immigrants | Albania | 70.7 /100 | #160 | Good 15.8% |
| Immigrants | Northern Africa | 68.1 /100 | #161 | Good 15.8% |
| Colombians | 67.6 /100 | #162 | Good 15.8% |
| Yugoslavians | 67.6 /100 | #163 | Good 15.8% |
| Immigrants | Germany | 67.3 /100 | #164 | Good 15.8% |
| Guamanians/Chamorros | 66.4 /100 | #165 | Good 15.9% |
| Immigrants | Oceania | 65.4 /100 | #166 | Good 15.9% |
| Costa Ricans | 61.1 /100 | #167 | Good 16.0% |
| South Americans | 57.9 /100 | #168 | Average 16.0% |
| Uruguayans | 54.7 /100 | #169 | Average 16.1% |
| Immigrants | Colombia | 54.4 /100 | #170 | Average 16.1% |
| Hungarians | 52.5 /100 | #171 | Average 16.2% |