Black/African American vs Italian Child Poverty Under the Age of 16
COMPARE
Black/African American
Italian
Child Poverty Under the Age of 16
Child Poverty Under the Age of 16 Comparison
Blacks/African Americans
Italians
24.4%
CHILD POVERTY UNDER THE AGE OF 16
0.0/ 100
METRIC RATING
334th/ 347
METRIC RANK
13.9%
CHILD POVERTY UNDER THE AGE OF 16
99.2/ 100
METRIC RATING
49th/ 347
METRIC RANK
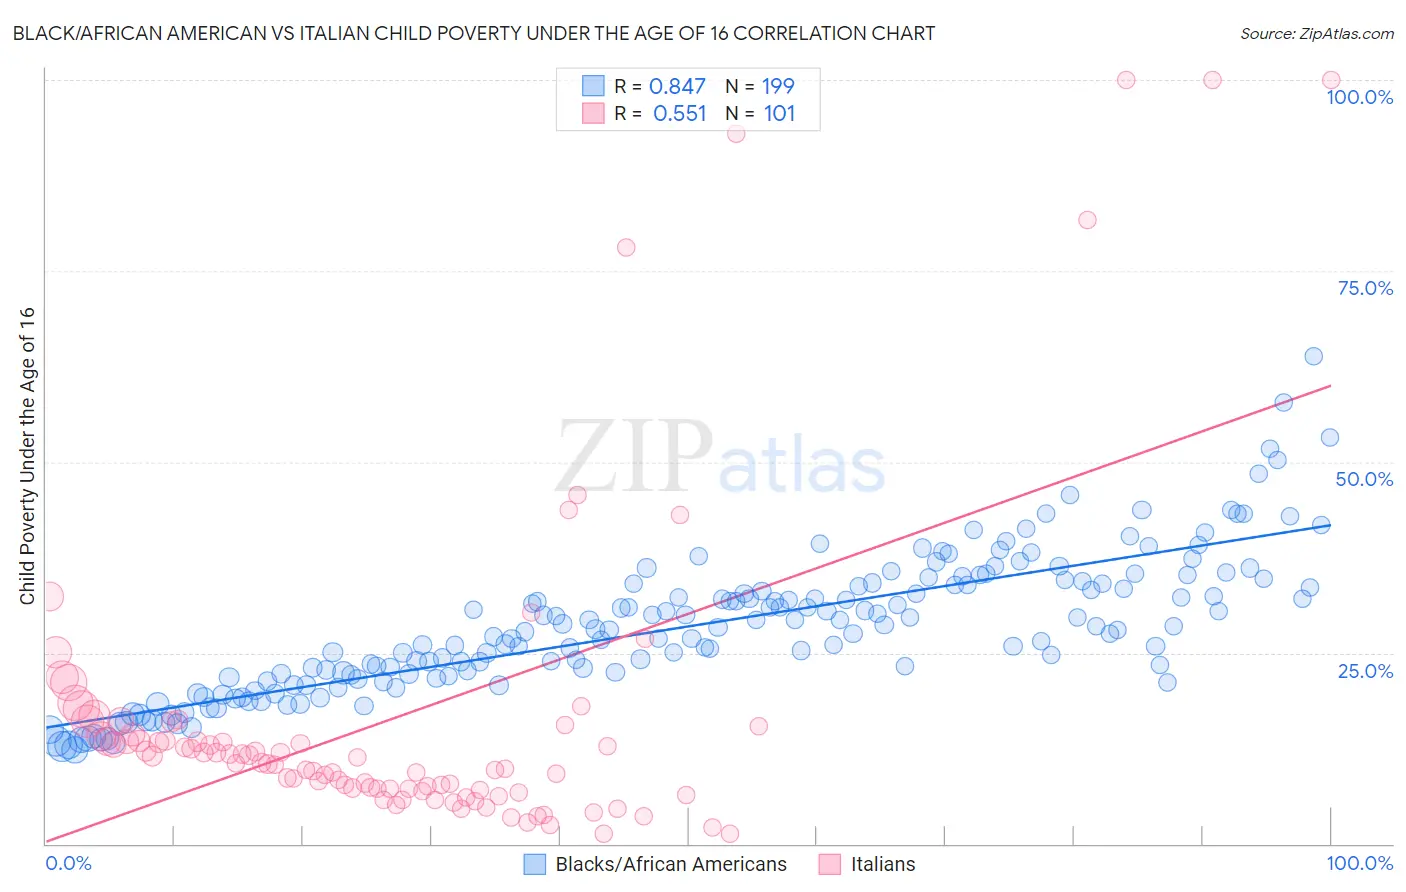
Black/African American vs Italian Child Poverty Under the Age of 16 Correlation Chart
The statistical analysis conducted on geographies consisting of 555,331,185 people shows a very strong positive correlation between the proportion of Blacks/African Americans and poverty level among children under the age of 16 in the United States with a correlation coefficient (R) of 0.847 and weighted average of 24.4%. Similarly, the statistical analysis conducted on geographies consisting of 561,533,046 people shows a substantial positive correlation between the proportion of Italians and poverty level among children under the age of 16 in the United States with a correlation coefficient (R) of 0.551 and weighted average of 13.9%, a difference of 76.1%.
Child Poverty Under the Age of 16 Correlation Summary
| Measurement | Black/African American | Italian |
| Minimum | 12.3% | 1.3% |
| Maximum | 63.9% | 100.0% |
| Range | 51.6% | 98.7% |
| Mean | 28.4% | 16.5% |
| Median | 28.1% | 10.6% |
| Interquartile 25% (IQ1) | 22.0% | 7.1% |
| Interquartile 75% (IQ3) | 33.9% | 14.8% |
| Interquartile Range (IQR) | 11.9% | 7.7% |
| Standard Deviation (Sample) | 9.0% | 20.8% |
| Standard Deviation (Population) | 9.0% | 20.7% |
Similar Demographics by Child Poverty Under the Age of 16
Demographics Similar to Blacks/African Americans by Child Poverty Under the Age of 16
In terms of child poverty under the age of 16, the demographic groups most similar to Blacks/African Americans are Houma (24.9%, a difference of 1.7%), Immigrants from Dominican Republic (24.0%, a difference of 2.0%), Pueblo (23.9%, a difference of 2.1%), Apache (23.8%, a difference of 2.5%), and Native/Alaskan (23.8%, a difference of 2.8%).
| Demographics | Rating | Rank | Child Poverty Under the Age of 16 |
| Menominee | 0.0 /100 | #327 | Tragic 23.0% |
| Colville | 0.0 /100 | #328 | Tragic 23.0% |
| Dominicans | 0.0 /100 | #329 | Tragic 23.8% |
| Natives/Alaskans | 0.0 /100 | #330 | Tragic 23.8% |
| Apache | 0.0 /100 | #331 | Tragic 23.8% |
| Pueblo | 0.0 /100 | #332 | Tragic 23.9% |
| Immigrants | Dominican Republic | 0.0 /100 | #333 | Tragic 24.0% |
| Blacks/African Americans | 0.0 /100 | #334 | Tragic 24.4% |
| Houma | 0.0 /100 | #335 | Tragic 24.9% |
| Yup'ik | 0.0 /100 | #336 | Tragic 25.1% |
| Sioux | 0.0 /100 | #337 | Tragic 25.2% |
| Cheyenne | 0.0 /100 | #338 | Tragic 25.4% |
| Crow | 0.0 /100 | #339 | Tragic 26.0% |
| Hopi | 0.0 /100 | #340 | Tragic 27.1% |
| Yuman | 0.0 /100 | #341 | Tragic 28.9% |
Demographics Similar to Italians by Child Poverty Under the Age of 16
In terms of child poverty under the age of 16, the demographic groups most similar to Italians are Korean (13.9%, a difference of 0.030%), Estonian (13.9%, a difference of 0.090%), Immigrants from Czechoslovakia (13.9%, a difference of 0.23%), Immigrants from Asia (13.8%, a difference of 0.25%), and Immigrants from Greece (13.9%, a difference of 0.35%).
| Demographics | Rating | Rank | Child Poverty Under the Age of 16 |
| Immigrants | Sri Lanka | 99.3 /100 | #42 | Exceptional 13.8% |
| Immigrants | Moldova | 99.3 /100 | #43 | Exceptional 13.8% |
| Greeks | 99.3 /100 | #44 | Exceptional 13.8% |
| Czechs | 99.3 /100 | #45 | Exceptional 13.8% |
| Immigrants | Asia | 99.2 /100 | #46 | Exceptional 13.8% |
| Estonians | 99.2 /100 | #47 | Exceptional 13.9% |
| Koreans | 99.2 /100 | #48 | Exceptional 13.9% |
| Italians | 99.2 /100 | #49 | Exceptional 13.9% |
| Immigrants | Czechoslovakia | 99.1 /100 | #50 | Exceptional 13.9% |
| Immigrants | Greece | 99.1 /100 | #51 | Exceptional 13.9% |
| Poles | 98.9 /100 | #52 | Exceptional 14.0% |
| Immigrants | Israel | 98.8 /100 | #53 | Exceptional 14.1% |
| Tsimshian | 98.8 /100 | #54 | Exceptional 14.1% |
| Immigrants | Indonesia | 98.7 /100 | #55 | Exceptional 14.1% |
| Immigrants | Serbia | 98.7 /100 | #56 | Exceptional 14.1% |