Hawaiian vs Immigrants from Germany Child Poverty Under the Age of 16
COMPARE
Hawaiian
Immigrants from Germany
Child Poverty Under the Age of 16
Child Poverty Under the Age of 16 Comparison
Hawaiians
Immigrants from Germany
16.4%
CHILD POVERTY UNDER THE AGE OF 16
38.2/ 100
METRIC RATING
182nd/ 347
METRIC RANK
15.8%
CHILD POVERTY UNDER THE AGE OF 16
67.3/ 100
METRIC RATING
164th/ 347
METRIC RANK
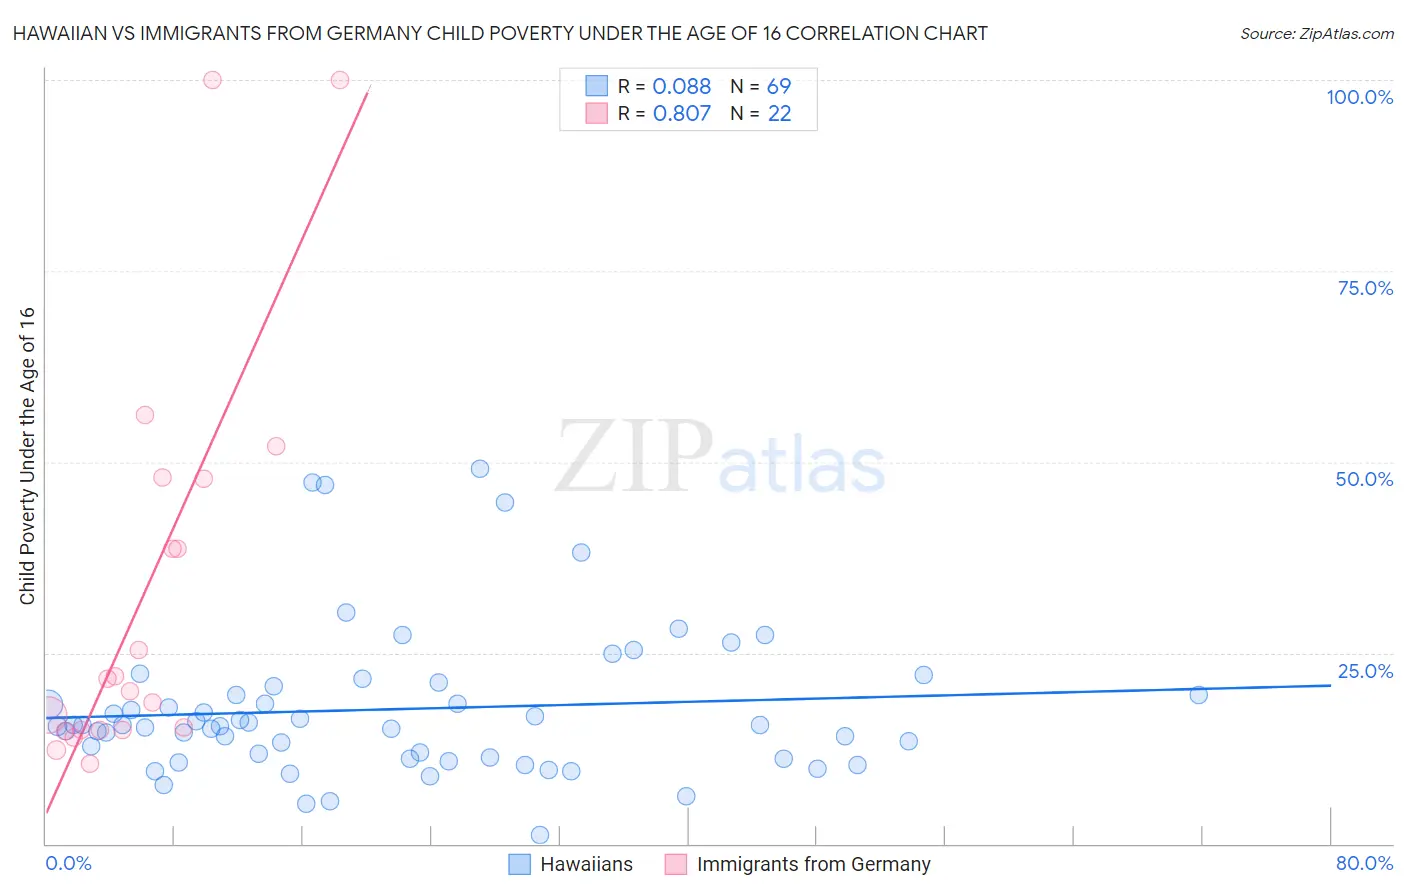
Hawaiian vs Immigrants from Germany Child Poverty Under the Age of 16 Correlation Chart
The statistical analysis conducted on geographies consisting of 325,733,413 people shows a slight positive correlation between the proportion of Hawaiians and poverty level among children under the age of 16 in the United States with a correlation coefficient (R) of 0.088 and weighted average of 16.4%. Similarly, the statistical analysis conducted on geographies consisting of 458,231,020 people shows a very strong positive correlation between the proportion of Immigrants from Germany and poverty level among children under the age of 16 in the United States with a correlation coefficient (R) of 0.807 and weighted average of 15.8%, a difference of 3.7%.
Child Poverty Under the Age of 16 Correlation Summary
| Measurement | Hawaiian | Immigrants from Germany |
| Minimum | 1.1% | 10.5% |
| Maximum | 49.1% | 100.0% |
| Range | 48.0% | 89.5% |
| Mean | 17.6% | 32.6% |
| Median | 15.5% | 20.8% |
| Interquartile 25% (IQ1) | 11.2% | 14.9% |
| Interquartile 75% (IQ3) | 20.1% | 47.8% |
| Interquartile Range (IQR) | 8.8% | 32.9% |
| Standard Deviation (Sample) | 9.7% | 26.1% |
| Standard Deviation (Population) | 9.6% | 25.5% |
Demographics Similar to Hawaiians and Immigrants from Germany by Child Poverty Under the Age of 16
In terms of child poverty under the age of 16, the demographic groups most similar to Hawaiians are Celtic (16.4%, a difference of 0.010%), Immigrants from South America (16.4%, a difference of 0.32%), South American Indian (16.4%, a difference of 0.45%), Immigrants from Ethiopia (16.4%, a difference of 0.50%), and Immigrants from Syria (16.4%, a difference of 0.50%). Similarly, the demographic groups most similar to Immigrants from Germany are Yugoslavian (15.8%, a difference of 0.040%), Guamanian/Chamorro (15.9%, a difference of 0.13%), Immigrants from Oceania (15.9%, a difference of 0.27%), Costa Rican (16.0%, a difference of 0.84%), and South American (16.0%, a difference of 1.2%).
| Demographics | Rating | Rank | Child Poverty Under the Age of 16 |
| Yugoslavians | 67.6 /100 | #163 | Good 15.8% |
| Immigrants | Germany | 67.3 /100 | #164 | Good 15.8% |
| Guamanians/Chamorros | 66.4 /100 | #165 | Good 15.9% |
| Immigrants | Oceania | 65.4 /100 | #166 | Good 15.9% |
| Costa Ricans | 61.1 /100 | #167 | Good 16.0% |
| South Americans | 57.9 /100 | #168 | Average 16.0% |
| Uruguayans | 54.7 /100 | #169 | Average 16.1% |
| Immigrants | Colombia | 54.4 /100 | #170 | Average 16.1% |
| Hungarians | 52.5 /100 | #171 | Average 16.2% |
| Afghans | 52.3 /100 | #172 | Average 16.2% |
| Immigrants | Saudi Arabia | 52.1 /100 | #173 | Average 16.2% |
| Whites/Caucasians | 50.0 /100 | #174 | Average 16.2% |
| Scotch-Irish | 47.1 /100 | #175 | Average 16.3% |
| Lebanese | 45.9 /100 | #176 | Average 16.3% |
| Ethiopians | 43.4 /100 | #177 | Average 16.3% |
| Immigrants | Ethiopia | 42.3 /100 | #178 | Average 16.4% |
| Immigrants | Syria | 42.3 /100 | #179 | Average 16.4% |
| South American Indians | 41.8 /100 | #180 | Average 16.4% |
| Immigrants | South America | 40.8 /100 | #181 | Average 16.4% |
| Hawaiians | 38.2 /100 | #182 | Fair 16.4% |
| Celtics | 38.2 /100 | #183 | Fair 16.4% |