Black/African American vs U.S. Virgin Islander Child Poverty Under the Age of 16
COMPARE
Black/African American
U.S. Virgin Islander
Child Poverty Under the Age of 16
Child Poverty Under the Age of 16 Comparison
Blacks/African Americans
U.S. Virgin Islanders
24.4%
CHILD POVERTY UNDER THE AGE OF 16
0.0/ 100
METRIC RATING
334th/ 347
METRIC RANK
22.0%
CHILD POVERTY UNDER THE AGE OF 16
0.0/ 100
METRIC RATING
318th/ 347
METRIC RANK
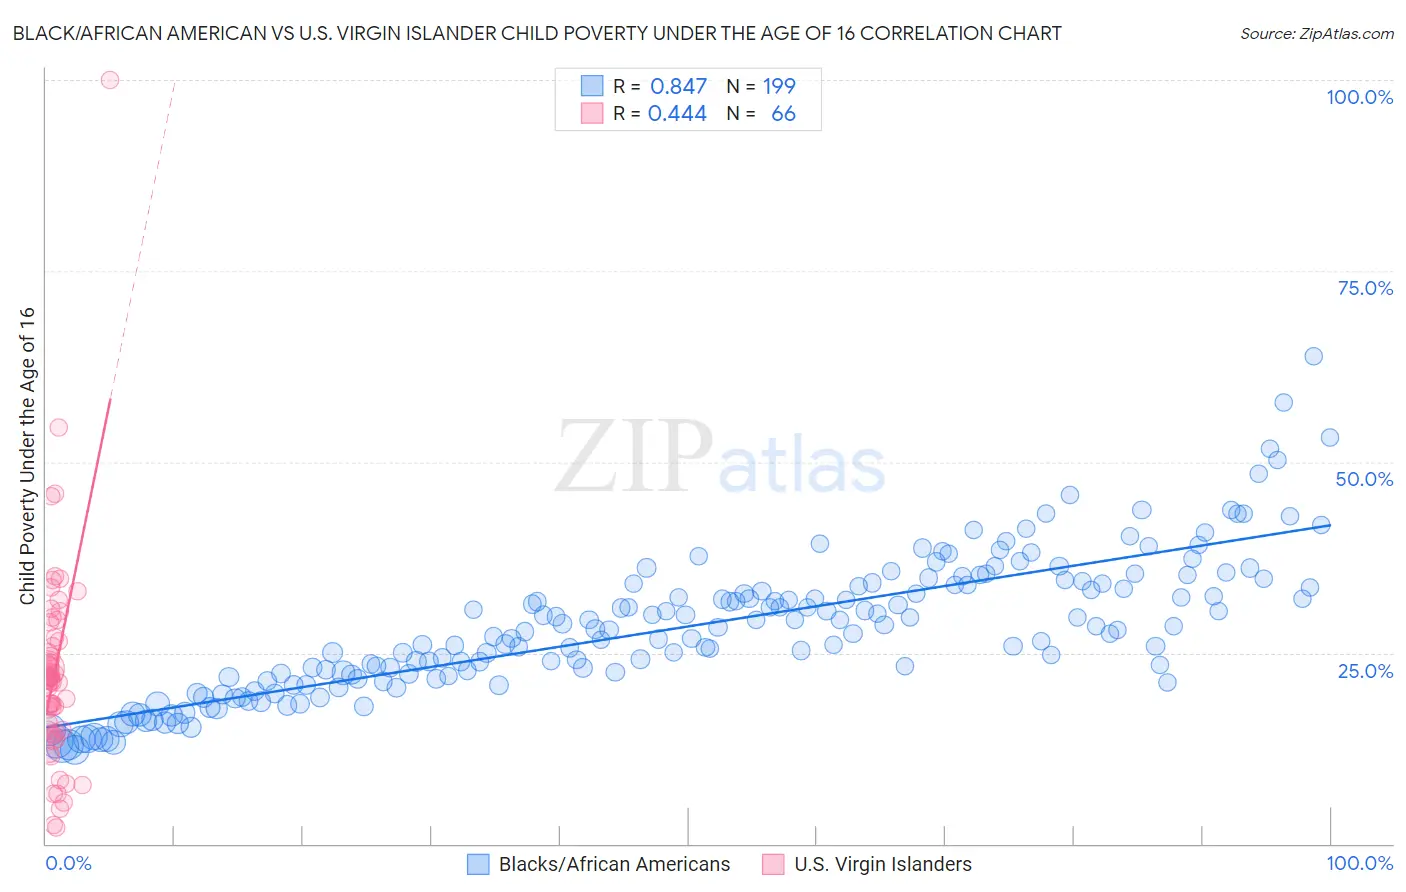
Black/African American vs U.S. Virgin Islander Child Poverty Under the Age of 16 Correlation Chart
The statistical analysis conducted on geographies consisting of 555,331,185 people shows a very strong positive correlation between the proportion of Blacks/African Americans and poverty level among children under the age of 16 in the United States with a correlation coefficient (R) of 0.847 and weighted average of 24.4%. Similarly, the statistical analysis conducted on geographies consisting of 87,405,194 people shows a moderate positive correlation between the proportion of U.S. Virgin Islanders and poverty level among children under the age of 16 in the United States with a correlation coefficient (R) of 0.444 and weighted average of 22.0%, a difference of 11.3%.
Child Poverty Under the Age of 16 Correlation Summary
| Measurement | Black/African American | U.S. Virgin Islander |
| Minimum | 12.3% | 2.1% |
| Maximum | 63.9% | 100.0% |
| Range | 51.6% | 97.9% |
| Mean | 28.4% | 22.4% |
| Median | 28.1% | 21.5% |
| Interquartile 25% (IQ1) | 22.0% | 14.9% |
| Interquartile 75% (IQ3) | 33.9% | 26.5% |
| Interquartile Range (IQR) | 11.9% | 11.6% |
| Standard Deviation (Sample) | 9.0% | 14.0% |
| Standard Deviation (Population) | 9.0% | 13.9% |
Demographics Similar to Blacks/African Americans and U.S. Virgin Islanders by Child Poverty Under the Age of 16
In terms of child poverty under the age of 16, the demographic groups most similar to Blacks/African Americans are Houma (24.9%, a difference of 1.7%), Immigrants from Dominican Republic (24.0%, a difference of 2.0%), Pueblo (23.9%, a difference of 2.1%), Apache (23.8%, a difference of 2.5%), and Native/Alaskan (23.8%, a difference of 2.8%). Similarly, the demographic groups most similar to U.S. Virgin Islanders are Immigrants from Dominica (21.9%, a difference of 0.40%), Yakama (22.1%, a difference of 0.51%), Cajun (22.1%, a difference of 0.71%), Kiowa (22.2%, a difference of 0.90%), and Honduran (22.2%, a difference of 1.1%).
| Demographics | Rating | Rank | Child Poverty Under the Age of 16 |
| Africans | 0.0 /100 | #316 | Tragic 21.7% |
| Immigrants | Dominica | 0.0 /100 | #317 | Tragic 21.9% |
| U.S. Virgin Islanders | 0.0 /100 | #318 | Tragic 22.0% |
| Yakama | 0.0 /100 | #319 | Tragic 22.1% |
| Cajuns | 0.0 /100 | #320 | Tragic 22.1% |
| Kiowa | 0.0 /100 | #321 | Tragic 22.2% |
| Hondurans | 0.0 /100 | #322 | Tragic 22.2% |
| Paiute | 0.0 /100 | #323 | Tragic 22.4% |
| Central American Indians | 0.0 /100 | #324 | Tragic 22.5% |
| Immigrants | Congo | 0.0 /100 | #325 | Tragic 22.5% |
| Immigrants | Honduras | 0.0 /100 | #326 | Tragic 22.7% |
| Menominee | 0.0 /100 | #327 | Tragic 23.0% |
| Colville | 0.0 /100 | #328 | Tragic 23.0% |
| Dominicans | 0.0 /100 | #329 | Tragic 23.8% |
| Natives/Alaskans | 0.0 /100 | #330 | Tragic 23.8% |
| Apache | 0.0 /100 | #331 | Tragic 23.8% |
| Pueblo | 0.0 /100 | #332 | Tragic 23.9% |
| Immigrants | Dominican Republic | 0.0 /100 | #333 | Tragic 24.0% |
| Blacks/African Americans | 0.0 /100 | #334 | Tragic 24.4% |
| Houma | 0.0 /100 | #335 | Tragic 24.9% |
| Yup'ik | 0.0 /100 | #336 | Tragic 25.1% |