British West Indian vs U.S. Virgin Islander Receiving Food Stamps
COMPARE
British West Indian
U.S. Virgin Islander
Receiving Food Stamps
Receiving Food Stamps Comparison
British West Indians
U.S. Virgin Islanders
17.9%
RECEIVING FOOD STAMPS
0.0/ 100
METRIC RATING
324th/ 347
METRIC RANK
16.5%
RECEIVING FOOD STAMPS
0.0/ 100
METRIC RATING
309th/ 347
METRIC RANK
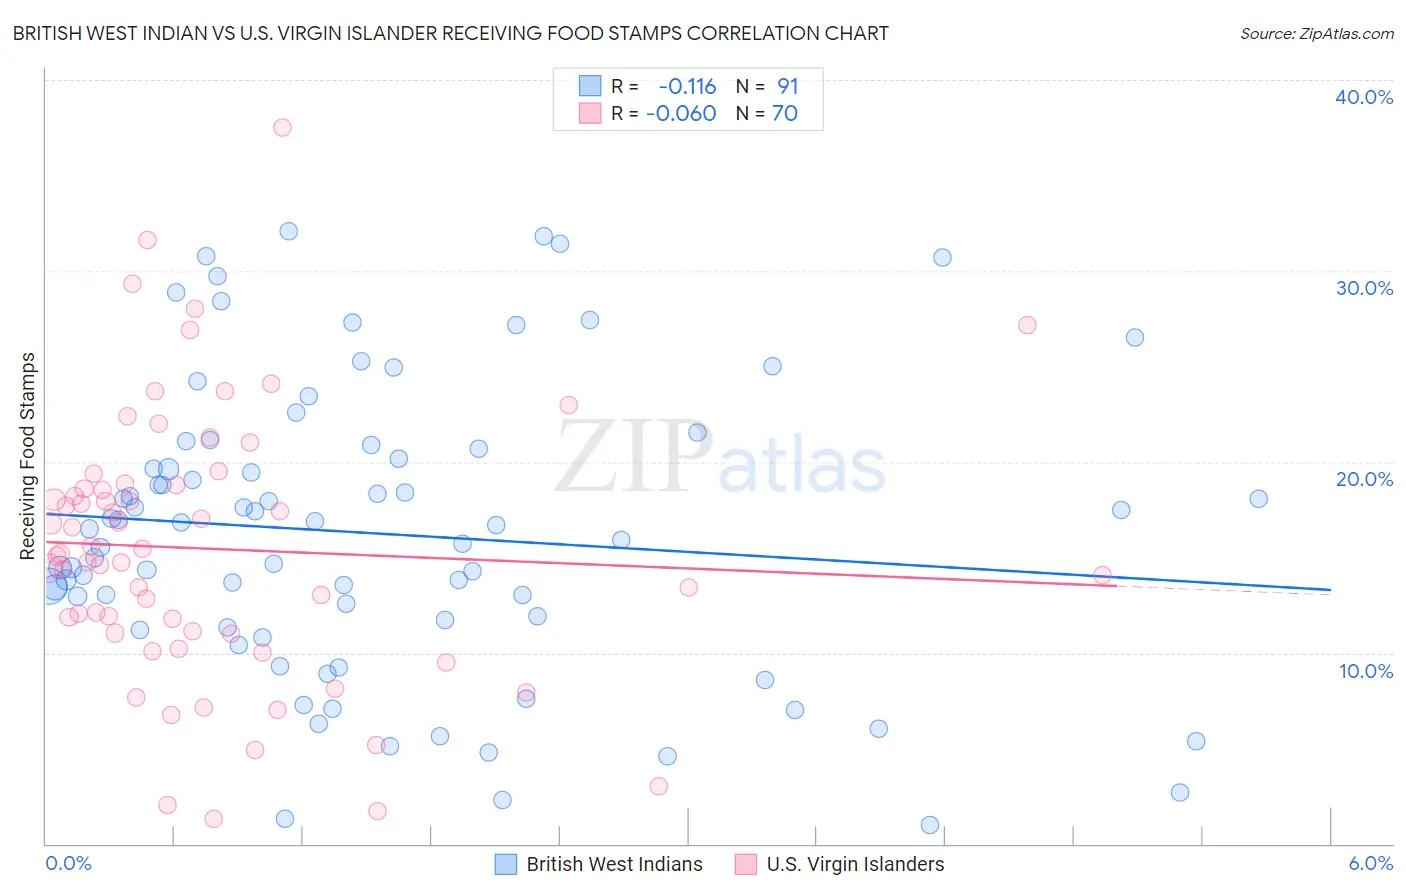
British West Indian vs U.S. Virgin Islander Receiving Food Stamps Correlation Chart
The statistical analysis conducted on geographies consisting of 152,421,558 people shows a poor negative correlation between the proportion of British West Indians and percentage of population receiving government assistance and/or food stamps in the United States with a correlation coefficient (R) of -0.116 and weighted average of 17.9%. Similarly, the statistical analysis conducted on geographies consisting of 87,412,076 people shows a slight negative correlation between the proportion of U.S. Virgin Islanders and percentage of population receiving government assistance and/or food stamps in the United States with a correlation coefficient (R) of -0.060 and weighted average of 16.5%, a difference of 8.2%.
Receiving Food Stamps Correlation Summary
| Measurement | British West Indian | U.S. Virgin Islander |
| Minimum | 1.0% | 1.3% |
| Maximum | 32.1% | 37.5% |
| Range | 31.1% | 36.2% |
| Mean | 16.2% | 15.4% |
| Median | 16.5% | 15.1% |
| Interquartile 25% (IQ1) | 11.3% | 11.0% |
| Interquartile 75% (IQ3) | 20.7% | 18.8% |
| Interquartile Range (IQR) | 9.4% | 7.8% |
| Standard Deviation (Sample) | 7.6% | 7.1% |
| Standard Deviation (Population) | 7.5% | 7.1% |
Demographics Similar to British West Indians and U.S. Virgin Islanders by Receiving Food Stamps
In terms of receiving food stamps, the demographic groups most similar to British West Indians are Immigrants from Grenada (17.8%, a difference of 0.59%), Haitian (17.8%, a difference of 0.59%), Immigrants from Haiti (18.2%, a difference of 1.8%), Cuban (18.2%, a difference of 1.9%), and Native/Alaskan (17.3%, a difference of 3.5%). Similarly, the demographic groups most similar to U.S. Virgin Islanders are Barbadian (16.5%, a difference of 0.24%), Houma (16.5%, a difference of 0.50%), Immigrants from Barbados (16.6%, a difference of 0.56%), Jamaican (16.4%, a difference of 0.79%), and Guyanese (16.7%, a difference of 1.1%).
| Demographics | Rating | Rank | Receiving Food Stamps |
| Jamaicans | 0.0 /100 | #306 | Tragic 16.4% |
| Houma | 0.0 /100 | #307 | Tragic 16.5% |
| Barbadians | 0.0 /100 | #308 | Tragic 16.5% |
| U.S. Virgin Islanders | 0.0 /100 | #309 | Tragic 16.5% |
| Immigrants | Barbados | 0.0 /100 | #310 | Tragic 16.6% |
| Guyanese | 0.0 /100 | #311 | Tragic 16.7% |
| Sioux | 0.0 /100 | #312 | Tragic 16.8% |
| Immigrants | Jamaica | 0.0 /100 | #313 | Tragic 16.9% |
| Immigrants | Guyana | 0.0 /100 | #314 | Tragic 16.9% |
| Bahamians | 0.0 /100 | #315 | Tragic 17.0% |
| Central American Indians | 0.0 /100 | #316 | Tragic 17.1% |
| Blacks/African Americans | 0.0 /100 | #317 | Tragic 17.2% |
| Menominee | 0.0 /100 | #318 | Tragic 17.2% |
| Immigrants | St. Vincent and the Grenadines | 0.0 /100 | #319 | Tragic 17.2% |
| Immigrants | Nicaragua | 0.0 /100 | #320 | Tragic 17.2% |
| Natives/Alaskans | 0.0 /100 | #321 | Tragic 17.3% |
| Immigrants | Grenada | 0.0 /100 | #322 | Tragic 17.8% |
| Haitians | 0.0 /100 | #323 | Tragic 17.8% |
| British West Indians | 0.0 /100 | #324 | Tragic 17.9% |
| Immigrants | Haiti | 0.0 /100 | #325 | Tragic 18.2% |
| Cubans | 0.0 /100 | #326 | Tragic 18.2% |