Czechoslovakian vs U.S. Virgin Islander Receiving Food Stamps
COMPARE
Czechoslovakian
U.S. Virgin Islander
Receiving Food Stamps
Receiving Food Stamps Comparison
Czechoslovakians
U.S. Virgin Islanders
10.3%
RECEIVING FOOD STAMPS
97.2/ 100
METRIC RATING
97th/ 347
METRIC RANK
16.5%
RECEIVING FOOD STAMPS
0.0/ 100
METRIC RATING
309th/ 347
METRIC RANK
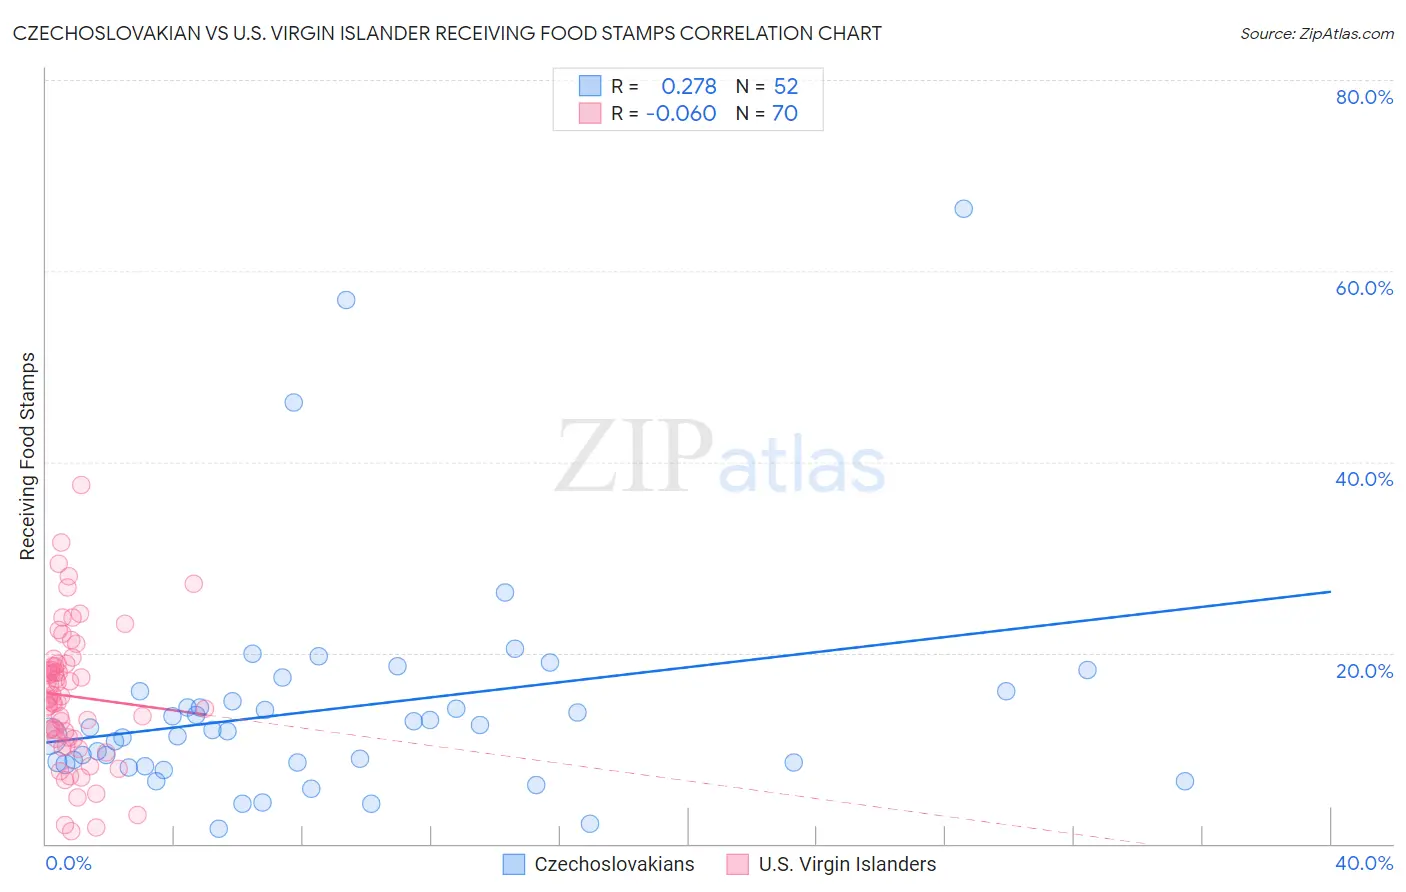
Czechoslovakian vs U.S. Virgin Islander Receiving Food Stamps Correlation Chart
The statistical analysis conducted on geographies consisting of 367,706,231 people shows a weak positive correlation between the proportion of Czechoslovakians and percentage of population receiving government assistance and/or food stamps in the United States with a correlation coefficient (R) of 0.278 and weighted average of 10.3%. Similarly, the statistical analysis conducted on geographies consisting of 87,412,076 people shows a slight negative correlation between the proportion of U.S. Virgin Islanders and percentage of population receiving government assistance and/or food stamps in the United States with a correlation coefficient (R) of -0.060 and weighted average of 16.5%, a difference of 60.7%.
Receiving Food Stamps Correlation Summary
| Measurement | Czechoslovakian | U.S. Virgin Islander |
| Minimum | 1.6% | 1.3% |
| Maximum | 66.5% | 37.5% |
| Range | 64.9% | 36.2% |
| Mean | 14.2% | 15.4% |
| Median | 11.9% | 15.1% |
| Interquartile 25% (IQ1) | 8.4% | 11.0% |
| Interquartile 75% (IQ3) | 15.4% | 18.8% |
| Interquartile Range (IQR) | 7.0% | 7.8% |
| Standard Deviation (Sample) | 11.9% | 7.1% |
| Standard Deviation (Population) | 11.8% | 7.1% |
Similar Demographics by Receiving Food Stamps
Demographics Similar to Czechoslovakians by Receiving Food Stamps
In terms of receiving food stamps, the demographic groups most similar to Czechoslovakians are Immigrants from Egypt (10.3%, a difference of 0.060%), Serbian (10.3%, a difference of 0.23%), Welsh (10.3%, a difference of 0.26%), Basque (10.3%, a difference of 0.31%), and Immigrants from Greece (10.3%, a difference of 0.34%).
| Demographics | Rating | Rank | Receiving Food Stamps |
| Finns | 97.9 /100 | #90 | Exceptional 10.2% |
| Jordanians | 97.9 /100 | #91 | Exceptional 10.2% |
| Irish | 97.9 /100 | #92 | Exceptional 10.2% |
| Belgians | 97.7 /100 | #93 | Exceptional 10.2% |
| Immigrants | Greece | 97.4 /100 | #94 | Exceptional 10.3% |
| Basques | 97.4 /100 | #95 | Exceptional 10.3% |
| Welsh | 97.3 /100 | #96 | Exceptional 10.3% |
| Czechoslovakians | 97.2 /100 | #97 | Exceptional 10.3% |
| Immigrants | Egypt | 97.1 /100 | #98 | Exceptional 10.3% |
| Serbians | 97.0 /100 | #99 | Exceptional 10.3% |
| Immigrants | Western Europe | 96.9 /100 | #100 | Exceptional 10.3% |
| Palestinians | 96.9 /100 | #101 | Exceptional 10.3% |
| Immigrants | Europe | 96.8 /100 | #102 | Exceptional 10.3% |
| Immigrants | Latvia | 96.8 /100 | #103 | Exceptional 10.3% |
| Immigrants | Hungary | 96.7 /100 | #104 | Exceptional 10.3% |
Demographics Similar to U.S. Virgin Islanders by Receiving Food Stamps
In terms of receiving food stamps, the demographic groups most similar to U.S. Virgin Islanders are Barbadian (16.5%, a difference of 0.24%), Houma (16.5%, a difference of 0.50%), Immigrants from Barbados (16.6%, a difference of 0.56%), Jamaican (16.4%, a difference of 0.79%), and Immigrants from the Azores (16.4%, a difference of 0.86%).
| Demographics | Rating | Rank | Receiving Food Stamps |
| Immigrants | West Indies | 0.0 /100 | #302 | Tragic 16.1% |
| Nicaraguans | 0.0 /100 | #303 | Tragic 16.1% |
| West Indians | 0.0 /100 | #304 | Tragic 16.3% |
| Immigrants | Azores | 0.0 /100 | #305 | Tragic 16.4% |
| Jamaicans | 0.0 /100 | #306 | Tragic 16.4% |
| Houma | 0.0 /100 | #307 | Tragic 16.5% |
| Barbadians | 0.0 /100 | #308 | Tragic 16.5% |
| U.S. Virgin Islanders | 0.0 /100 | #309 | Tragic 16.5% |
| Immigrants | Barbados | 0.0 /100 | #310 | Tragic 16.6% |
| Guyanese | 0.0 /100 | #311 | Tragic 16.7% |
| Sioux | 0.0 /100 | #312 | Tragic 16.8% |
| Immigrants | Jamaica | 0.0 /100 | #313 | Tragic 16.9% |
| Immigrants | Guyana | 0.0 /100 | #314 | Tragic 16.9% |
| Bahamians | 0.0 /100 | #315 | Tragic 17.0% |
| Central American Indians | 0.0 /100 | #316 | Tragic 17.1% |