Jordanian vs Immigrants from Russia Receiving Food Stamps
COMPARE
Jordanian
Immigrants from Russia
Receiving Food Stamps
Receiving Food Stamps Comparison
Jordanians
Immigrants from Russia
10.2%
RECEIVING FOOD STAMPS
97.9/ 100
METRIC RATING
91st/ 347
METRIC RANK
10.8%
RECEIVING FOOD STAMPS
90.9/ 100
METRIC RATING
133rd/ 347
METRIC RANK
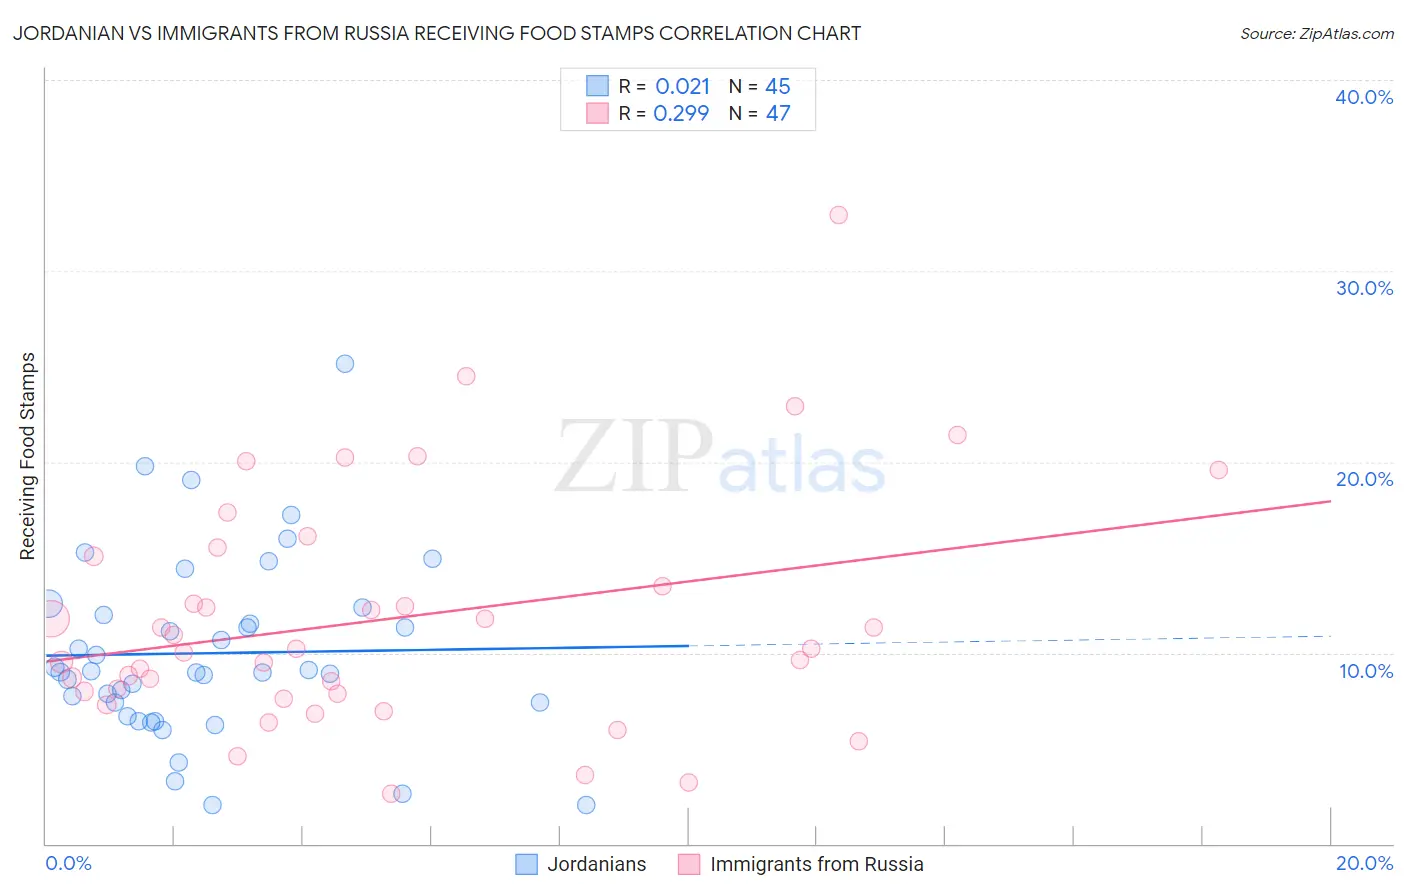
Jordanian vs Immigrants from Russia Receiving Food Stamps Correlation Chart
The statistical analysis conducted on geographies consisting of 166,269,073 people shows no correlation between the proportion of Jordanians and percentage of population receiving government assistance and/or food stamps in the United States with a correlation coefficient (R) of 0.021 and weighted average of 10.2%. Similarly, the statistical analysis conducted on geographies consisting of 346,828,802 people shows a weak positive correlation between the proportion of Immigrants from Russia and percentage of population receiving government assistance and/or food stamps in the United States with a correlation coefficient (R) of 0.299 and weighted average of 10.8%, a difference of 6.2%.
Receiving Food Stamps Correlation Summary
| Measurement | Jordanian | Immigrants from Russia |
| Minimum | 2.0% | 2.6% |
| Maximum | 25.2% | 32.9% |
| Range | 23.2% | 30.3% |
| Mean | 10.0% | 11.8% |
| Median | 9.0% | 10.2% |
| Interquartile 25% (IQ1) | 7.0% | 7.8% |
| Interquartile 75% (IQ3) | 12.2% | 15.1% |
| Interquartile Range (IQR) | 5.2% | 7.2% |
| Standard Deviation (Sample) | 4.8% | 6.2% |
| Standard Deviation (Population) | 4.7% | 6.1% |
Similar Demographics by Receiving Food Stamps
Demographics Similar to Jordanians by Receiving Food Stamps
In terms of receiving food stamps, the demographic groups most similar to Jordanians are Irish (10.2%, a difference of 0.0%), Finnish (10.2%, a difference of 0.040%), Belgian (10.2%, a difference of 0.39%), Immigrants from France (10.1%, a difference of 0.89%), and Immigrants from Greece (10.3%, a difference of 0.91%).
| Demographics | Rating | Rank | Receiving Food Stamps |
| Immigrants | Israel | 98.5 /100 | #84 | Exceptional 10.0% |
| Immigrants | Romania | 98.5 /100 | #85 | Exceptional 10.0% |
| Immigrants | Norway | 98.4 /100 | #86 | Exceptional 10.0% |
| Egyptians | 98.4 /100 | #87 | Exceptional 10.0% |
| Immigrants | Kuwait | 98.4 /100 | #88 | Exceptional 10.0% |
| Immigrants | France | 98.3 /100 | #89 | Exceptional 10.1% |
| Finns | 97.9 /100 | #90 | Exceptional 10.2% |
| Jordanians | 97.9 /100 | #91 | Exceptional 10.2% |
| Irish | 97.9 /100 | #92 | Exceptional 10.2% |
| Belgians | 97.7 /100 | #93 | Exceptional 10.2% |
| Immigrants | Greece | 97.4 /100 | #94 | Exceptional 10.3% |
| Basques | 97.4 /100 | #95 | Exceptional 10.3% |
| Welsh | 97.3 /100 | #96 | Exceptional 10.3% |
| Czechoslovakians | 97.2 /100 | #97 | Exceptional 10.3% |
| Immigrants | Egypt | 97.1 /100 | #98 | Exceptional 10.3% |
Demographics Similar to Immigrants from Russia by Receiving Food Stamps
In terms of receiving food stamps, the demographic groups most similar to Immigrants from Russia are Immigrants from Brazil (10.8%, a difference of 0.30%), Argentinean (10.8%, a difference of 0.32%), Slovak (10.8%, a difference of 0.49%), Immigrants from Germany (10.7%, a difference of 0.50%), and Immigrants from Eastern Europe (10.8%, a difference of 0.51%).
| Demographics | Rating | Rank | Receiving Food Stamps |
| Afghans | 92.6 /100 | #126 | Exceptional 10.7% |
| Immigrants | Ethiopia | 92.6 /100 | #127 | Exceptional 10.7% |
| Immigrants | Jordan | 92.5 /100 | #128 | Exceptional 10.7% |
| Yugoslavians | 92.5 /100 | #129 | Exceptional 10.7% |
| Israelis | 92.4 /100 | #130 | Exceptional 10.7% |
| French | 92.3 /100 | #131 | Exceptional 10.7% |
| Immigrants | Germany | 92.0 /100 | #132 | Exceptional 10.7% |
| Immigrants | Russia | 90.9 /100 | #133 | Exceptional 10.8% |
| Immigrants | Brazil | 90.3 /100 | #134 | Exceptional 10.8% |
| Argentineans | 90.2 /100 | #135 | Exceptional 10.8% |
| Slovaks | 89.8 /100 | #136 | Excellent 10.8% |
| Immigrants | Eastern Europe | 89.8 /100 | #137 | Excellent 10.8% |
| Immigrants | Moldova | 88.5 /100 | #138 | Excellent 10.9% |
| Hmong | 88.4 /100 | #139 | Excellent 10.9% |
| Celtics | 87.8 /100 | #140 | Excellent 10.9% |