Inupiat vs Immigrants from Lebanon Receiving Food Stamps
COMPARE
Inupiat
Immigrants from Lebanon
Receiving Food Stamps
Receiving Food Stamps Comparison
Inupiat
Immigrants from Lebanon
20.1%
RECEIVING FOOD STAMPS
0.0/ 100
METRIC RATING
333rd/ 347
METRIC RANK
11.3%
RECEIVING FOOD STAMPS
75.2/ 100
METRIC RATING
157th/ 347
METRIC RANK
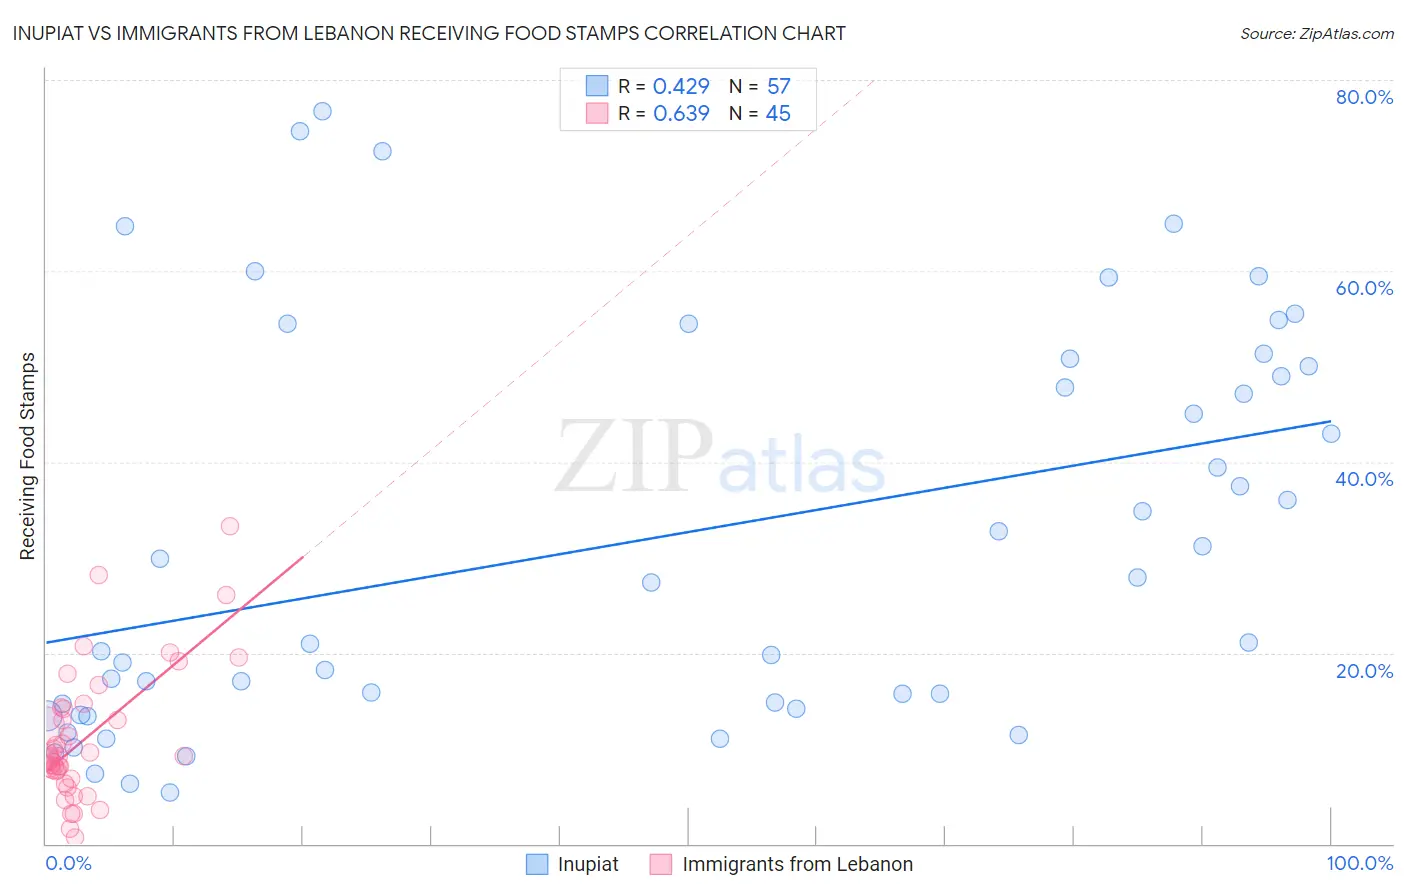
Inupiat vs Immigrants from Lebanon Receiving Food Stamps Correlation Chart
The statistical analysis conducted on geographies consisting of 96,290,078 people shows a moderate positive correlation between the proportion of Inupiat and percentage of population receiving government assistance and/or food stamps in the United States with a correlation coefficient (R) of 0.429 and weighted average of 20.1%. Similarly, the statistical analysis conducted on geographies consisting of 216,755,093 people shows a significant positive correlation between the proportion of Immigrants from Lebanon and percentage of population receiving government assistance and/or food stamps in the United States with a correlation coefficient (R) of 0.639 and weighted average of 11.3%, a difference of 77.7%.
Receiving Food Stamps Correlation Summary
| Measurement | Inupiat | Immigrants from Lebanon |
| Minimum | 5.4% | 0.70% |
| Maximum | 76.7% | 33.2% |
| Range | 71.3% | 32.5% |
| Mean | 32.0% | 11.1% |
| Median | 27.3% | 9.2% |
| Interquartile 25% (IQ1) | 14.4% | 7.2% |
| Interquartile 75% (IQ3) | 50.4% | 14.2% |
| Interquartile Range (IQR) | 36.0% | 7.0% |
| Standard Deviation (Sample) | 20.6% | 6.9% |
| Standard Deviation (Population) | 20.4% | 6.8% |
Similar Demographics by Receiving Food Stamps
Demographics Similar to Inupiat by Receiving Food Stamps
In terms of receiving food stamps, the demographic groups most similar to Inupiat are Pueblo (19.9%, a difference of 0.73%), Yuman (20.2%, a difference of 0.86%), Immigrants from Caribbean (19.6%, a difference of 2.2%), Immigrants from Cuba (20.8%, a difference of 3.8%), and Navajo (21.1%, a difference of 5.0%).
| Demographics | Rating | Rank | Receiving Food Stamps |
| Cubans | 0.0 /100 | #326 | Tragic 18.2% |
| Apache | 0.0 /100 | #327 | Tragic 18.3% |
| Colville | 0.0 /100 | #328 | Tragic 18.3% |
| Immigrants | Dominica | 0.0 /100 | #329 | Tragic 18.4% |
| Pima | 0.0 /100 | #330 | Tragic 19.0% |
| Immigrants | Caribbean | 0.0 /100 | #331 | Tragic 19.6% |
| Pueblo | 0.0 /100 | #332 | Tragic 19.9% |
| Inupiat | 0.0 /100 | #333 | Tragic 20.1% |
| Yuman | 0.0 /100 | #334 | Tragic 20.2% |
| Immigrants | Cuba | 0.0 /100 | #335 | Tragic 20.8% |
| Navajo | 0.0 /100 | #336 | Tragic 21.1% |
| Cape Verdeans | 0.0 /100 | #337 | Tragic 21.1% |
| Dominicans | 0.0 /100 | #338 | Tragic 21.4% |
| Yakama | 0.0 /100 | #339 | Tragic 21.4% |
| Tohono O'odham | 0.0 /100 | #340 | Tragic 21.5% |
Demographics Similar to Immigrants from Lebanon by Receiving Food Stamps
In terms of receiving food stamps, the demographic groups most similar to Immigrants from Lebanon are Immigrants from Afghanistan (11.3%, a difference of 0.080%), Immigrants from Bosnia and Herzegovina (11.3%, a difference of 0.49%), Immigrants from Oceania (11.4%, a difference of 0.87%), French Canadian (11.4%, a difference of 1.0%), and Immigrants from Argentina (11.2%, a difference of 1.1%).
| Demographics | Rating | Rank | Receiving Food Stamps |
| Soviet Union | 83.1 /100 | #150 | Excellent 11.1% |
| Immigrants | Spain | 81.7 /100 | #151 | Excellent 11.1% |
| Immigrants | Kazakhstan | 81.7 /100 | #152 | Excellent 11.1% |
| Lebanese | 81.6 /100 | #153 | Excellent 11.1% |
| Armenians | 81.4 /100 | #154 | Excellent 11.1% |
| Immigrants | Argentina | 80.4 /100 | #155 | Excellent 11.2% |
| Immigrants | Afghanistan | 75.6 /100 | #156 | Good 11.3% |
| Immigrants | Lebanon | 75.2 /100 | #157 | Good 11.3% |
| Immigrants | Bosnia and Herzegovina | 72.6 /100 | #158 | Good 11.3% |
| Immigrants | Oceania | 70.4 /100 | #159 | Good 11.4% |
| French Canadians | 69.5 /100 | #160 | Good 11.4% |
| Pennsylvania Germans | 68.4 /100 | #161 | Good 11.4% |
| Alsatians | 68.0 /100 | #162 | Good 11.4% |
| Immigrants | Southern Europe | 65.8 /100 | #163 | Good 11.5% |
| Immigrants | Chile | 65.0 /100 | #164 | Good 11.5% |