Belgian vs Choctaw Single Father Poverty
COMPARE
Belgian
Choctaw
Single Father Poverty
Single Father Poverty Comparison
Belgians
Choctaw
16.8%
SINGLE FATHER POVERTY
5.3/ 100
METRIC RATING
228th/ 347
METRIC RANK
20.7%
SINGLE FATHER POVERTY
0.0/ 100
METRIC RATING
327th/ 347
METRIC RANK
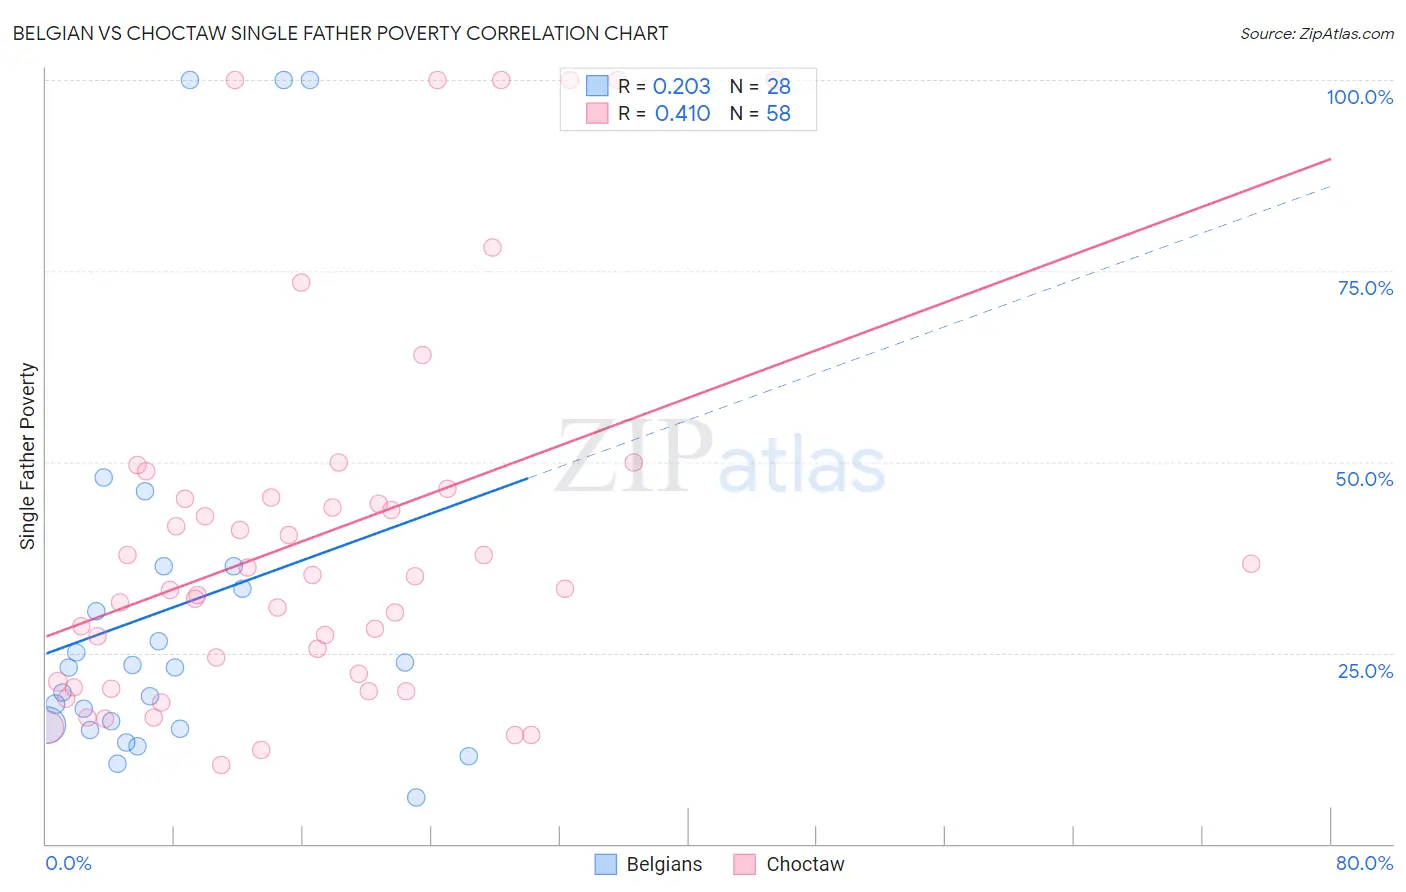
Belgian vs Choctaw Single Father Poverty Correlation Chart
The statistical analysis conducted on geographies consisting of 276,929,411 people shows a weak positive correlation between the proportion of Belgians and poverty level among single fathers in the United States with a correlation coefficient (R) of 0.203 and weighted average of 16.8%. Similarly, the statistical analysis conducted on geographies consisting of 228,054,527 people shows a moderate positive correlation between the proportion of Choctaw and poverty level among single fathers in the United States with a correlation coefficient (R) of 0.410 and weighted average of 20.7%, a difference of 23.3%.
Single Father Poverty Correlation Summary
| Measurement | Belgian | Choctaw |
| Minimum | 6.1% | 10.3% |
| Maximum | 100.0% | 100.0% |
| Range | 93.9% | 89.7% |
| Mean | 30.9% | 40.2% |
| Median | 23.0% | 34.2% |
| Interquartile 25% (IQ1) | 15.3% | 21.2% |
| Interquartile 75% (IQ3) | 34.8% | 45.3% |
| Interquartile Range (IQR) | 19.6% | 24.1% |
| Standard Deviation (Sample) | 26.4% | 24.9% |
| Standard Deviation (Population) | 25.9% | 24.7% |
Similar Demographics by Single Father Poverty
Demographics Similar to Belgians by Single Father Poverty
In terms of single father poverty, the demographic groups most similar to Belgians are British (16.8%, a difference of 0.070%), Hispanic or Latino (16.8%, a difference of 0.16%), Israeli (16.8%, a difference of 0.16%), Immigrants from Trinidad and Tobago (16.8%, a difference of 0.19%), and Menominee (16.8%, a difference of 0.21%).
| Demographics | Rating | Rank | Single Father Poverty |
| Immigrants | Greece | 8.1 /100 | #221 | Tragic 16.7% |
| Immigrants | Spain | 8.0 /100 | #222 | Tragic 16.7% |
| Immigrants | Austria | 7.0 /100 | #223 | Tragic 16.8% |
| Immigrants | Norway | 6.5 /100 | #224 | Tragic 16.8% |
| Menominee | 6.4 /100 | #225 | Tragic 16.8% |
| Hispanics or Latinos | 6.1 /100 | #226 | Tragic 16.8% |
| British | 5.6 /100 | #227 | Tragic 16.8% |
| Belgians | 5.3 /100 | #228 | Tragic 16.8% |
| Israelis | 4.6 /100 | #229 | Tragic 16.8% |
| Immigrants | Trinidad and Tobago | 4.5 /100 | #230 | Tragic 16.8% |
| Spanish Americans | 3.7 /100 | #231 | Tragic 16.9% |
| Immigrants | Grenada | 3.7 /100 | #232 | Tragic 16.9% |
| Senegalese | 3.2 /100 | #233 | Tragic 16.9% |
| Marshallese | 3.1 /100 | #234 | Tragic 16.9% |
| Immigrants | Western Europe | 2.9 /100 | #235 | Tragic 16.9% |
Demographics Similar to Choctaw by Single Father Poverty
In terms of single father poverty, the demographic groups most similar to Choctaw are Immigrants from Yemen (20.6%, a difference of 0.69%), Black/African American (20.4%, a difference of 1.7%), Pueblo (21.1%, a difference of 1.9%), Colville (21.4%, a difference of 3.0%), and American (20.1%, a difference of 3.3%).
| Demographics | Rating | Rank | Single Father Poverty |
| Inupiat | 0.0 /100 | #320 | Tragic 19.5% |
| Cherokee | 0.0 /100 | #321 | Tragic 19.6% |
| Creek | 0.0 /100 | #322 | Tragic 19.8% |
| Pennsylvania Germans | 0.0 /100 | #323 | Tragic 20.0% |
| Americans | 0.0 /100 | #324 | Tragic 20.1% |
| Blacks/African Americans | 0.0 /100 | #325 | Tragic 20.4% |
| Immigrants | Yemen | 0.0 /100 | #326 | Tragic 20.6% |
| Choctaw | 0.0 /100 | #327 | Tragic 20.7% |
| Pueblo | 0.0 /100 | #328 | Tragic 21.1% |
| Colville | 0.0 /100 | #329 | Tragic 21.4% |
| Paiute | 0.0 /100 | #330 | Tragic 21.6% |
| Central American Indians | 0.0 /100 | #331 | Tragic 21.7% |
| Tohono O'odham | 0.0 /100 | #332 | Tragic 22.0% |
| Natives/Alaskans | 0.0 /100 | #333 | Tragic 22.4% |
| Kiowa | 0.0 /100 | #334 | Tragic 22.5% |